The impact of good health on productive years, life expectancy and the economy
This blog is based on excerpts from a paper by Professor Les Mayhew, Associate Head of Global Research at the International Longevity Centre UK (ILC) and Professor of Statistics at Bayes Business School to be presented at the Longevity 19 Conference to be held in Amsterdam on 16 – 17 September 2024.
Key points
- For the first time in six decades of continuous improvement, life expectancy in the UK has stalled. Life expectancy of people aged 50+ is now 2.3 years lower than anticipated according to previous long-term trends.
- And this has big implications for people’s health too. A one-year loss in life expectancy equates on average to a 2.5-year loss in healthy years. For example, a UK male dying at age 80 could expect to spend on average 64.5 years in good health, but if his life expectancy is only 78, he will spend less than 60 years in good health.
- This impact on health is experienced unevenly. In the least healthy local authorities, the gap between male healthy life expectancy and male life expectancy is 21 years and in the healthiest only 10 years, a two-fold difference. The health gap is widest between ages 60 and 64 – crucial ages at which many fall out of the workforce when they would like to continue to work.
- And this isn’t the same across the world. The UK is an outlier in terms of recent changes in life expectancy globally and is one of only four major countries with stalled life expectancy. Out of 17 advanced economies, 11 increased life expectancy at age 50 between 2010 and 2020.
- We need greater investment in jobs and skills as well as healthier lifestyles earlier in the life course. More spending needs to be directed towards prevention, and there needs to be greater regulation of the things that do us harm.
- The demographic imbalances are startling: of the 31.5m of working age 2.8m are off work due to long term illness. Meanwhile labour market gaps are being plugged by record levels of net immigration which is running at 700,000 p.a. compared with 200,000 in 2012. With the rise in the median age of the population from 38 to 41 by 2040, things are set to get worse before they get better
Introduction
The number of people over 50 increased by 18% from 21.6m in 2010 to 25.5m in 2020. People over 50 now make up 38% of the population and changes to their health and longevity matter to the whole economy. This latest analysis by the International Longevity Centre (ILC) looks at the changing life expectancy of UK adults over 50, how much the economy is affected and what needs to happen next.
Between 1950 and 2010, UK life expectancy at age 50 increased by 7.9 years to 32.7 years. But after six decades of almost continuous improvement and well before the COVID-19 pandemic, life expectancy in the UK began to stall, threatening people’s health and livelihoods. Then in 2020, the pandemic led to large increases in mortality which has exacerbated the problem causing life expectancy to fall further. Life expectancy of people aged 50+ is now 2.3 years lower than anticipated according to previous long-term trends.
A decline in life expectancy takes years from healthy lives but the effect is asymmetric. We estimate that a one-year loss in life expectancy equates on average to a 2.5-year loss in healthy years[1]. For example, a UK male dying at age 80 could expect to spend on average 64.5 years in good health, but if his life expectancy is only 78, he will spend less than 60 years in good health.
With ILC’s Healthy Ageing and Prevention Index showing that Britons spend an average of just over 31 years in work across their, such downward changes in life expectancy could have dire implications for the UK workforce and the economy.
We don’t know if the decline in life expectancy is a temporary blip, or a transition to a new norm – if it is the former, it is likely to take years to get back to trend.
Bold action is needed to address the challenges faced by a growing, ageing and unhealthier population to ensure a more sustainable public purse and sustained economic growth.
But inequalities in life span, although wide are less than inequalities in health (2016-2018)
Chart one (and Table 1 in the annex below) shows the number of years a man can expect to live over the next 5 years by age and deprivation.
We see that:
- The number of years someone can expect to live in the next 5 declines with age, but it is lowest in more deprived areas.
- It falls to 3.2 years at age 70-74 compared with 4.1 years in the least deprived decile, a gap of 0.9 years.
The gap in life expectancy is consistently much less than the gap in health at any given age. It means that, in this case, men from deprived deciles spend more years in ill health per 5-year age interval over the life course as well as die sooner.
Chart one: Expected years of life out of the next five by age interval and Indices of Multiple Deprivation (IMD) decile (English males 2018 – 2020)
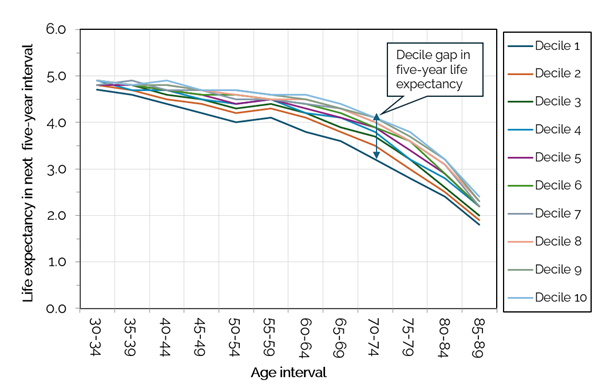
Partial life expectancy is the years a person of a given age is expected to live in this case out of five which is the maximum attainable.
Life expectancy started its relative decline in 2010 before COVID exposed deep-rooted problems in population health. The time spent in good health affects the demand for healthcare by bringing forward in time when health interventions are needed. Healthier people are more likely to be in work and use less health care.
This applies especially to older people who are growing in number and much more likely to use health services. Perhaps the most telling statistic is the rise in NHS waiting lists. The number of people waiting for planned treatments increased from 2.5m in 2010 to 5m in 2020 and as of February 2024 was at 7.5m[2].
Age and deprivation are strongly predictive of adult health inequalities and lifespan
Chart two (and Table 2 in the annex) shows the number of years an adult male can expect to live in good health over the next five years, broken up by age and deprivation.
We see that:
- A man living in the least deprived area, decile 10, is healthiest throughout the life course and in decile 1 the least.
- The health gap is widest between ages 60 and 64. An average man in the top decile will spend 3.6 of those 5 years in good health, while an average man in the bottom decile will spend half that time, just 1.8 of those 5 years, in good health. (see points A and B on the chart)
- A male aged 60 to 64 in the lowest decile has the same expectation of good health as a man aged 35 to 39 in decile 1 (see points A and C on the chart).
Chart two: Expected years spent in good health out of the next five by age interval and IMD decile (English males 2018 – 2020)
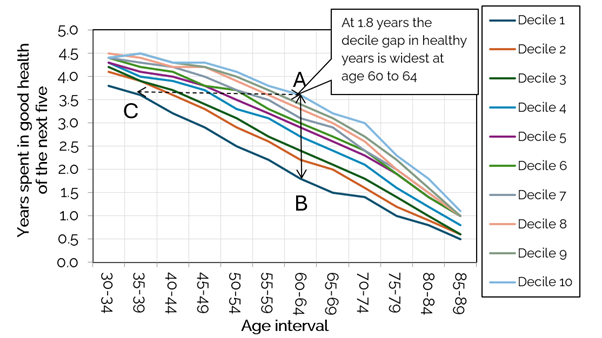
Health expectancy is the number of years an individual is expected to live in self-assessed good or very good health. The Index of Multiple Deprivation (IMD) is a measure of relative deprivation in England in which small areas are ranked and divided into deciles. The most deprived areas are in decile 1 and the least in 10.
This pattern is analogous to data from in 2011 to 2013.showing that very little has changed when it comes to health inequalities over the past decade.
Inequalities across the UK
Inequalities in health and lifespan are linked to geography. Chart three shows the gap between life span and health span by local English district.
We find that:
- There is an 18-year difference in health span between the least and most healthy authorities compared with an 8-year difference in life expectancy
- In the least healthy local authorities, the gap between male healthy life expectancy and life expectancy is 21 years and in the healthiest only 10 years, a two-fold difference.
- A one-year decline in life span reduces health span by 2.5 years – about the same as 2010-2012
- The district with the highest health span is Richmond-upon-Thames at 71.9 years with Blackpool the lowest at 53.3 years
Chart three: Life span versus health span by English local authority (males 2018 – 2020)

We are also falling behind our international competitors
The UK is an outlier in terms of recent changes in life expectancy globally and is one of only four major countries with stalled life expectancy.
Out of 17 advanced economies, 11 increased life expectancy at age 50 between 2010 and 2020. Most improved were Norway (+1.8 years). Finland (+1.5years), Australia (+1.5 years). Least improved but still positive were France and Netherlands.
Those in the ‘stalled’ category experienced small reductions. These were the US (-0.2 years), Italy (-0.2 years), Spain (-0.1 years), and the UK (-0.1 years).
Taking a longer view from 1950 onwards to 2020, the UK was consistently among the bottom ranked countries with the US being the lowest ranked in terms of improvements. In the period to 2020, average UK life expectancy at 50 increased by 7.8 years, the highest increase being Japan (+13.5) and the lowest the US (+5.9).
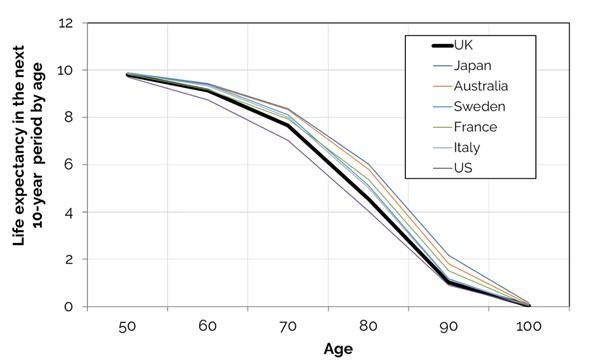
The following chart shows the extra years out of the next ten a person can expect to live by ten-year age interval and country. It shows inequalities in average life span persist at the international level when the UK is compared with competitor economies.
- With the exception of the USA, countries such as Japan, Australia Sweden, France and Italy all do better than the UK.
- The largest gap occurs is at age 70 and 80 of between 0.7 and 1.5 years of the next ten if the UK is compared with Japan.
- A 50-year-old Japanese person can expect to live 3.8 more years at age 50 than someone from the UK.
If we want people to live longer and more healthily and work longer these differences need to be eliminated.
The extent that the pattern of inequalities will continue to apply in future years is underpinned by the lack of meaningful progress since 2010.
- The median age of the population will increase from 38 in 2020 to 41 by 2040, making everyone slightly older and inequalities as well as health potentially worse.
- There are now 9.4m economically inactive persons in the UK compared with 8.7 million in 2019, putting the economy at risk.
- Of these 2.8m are long term sick compared with 2.1m in 2019 and a similar level in 2010. The demise in health in middle age is greater than the demise in life expectancy and the gap is increasing.
- Broader labour supply problems in the economy coupled with high levels of inactivity are mirrored in net-migration figures which is running at 700,000 p.a. compared with 200,000 in 2012
What needs to happen next?
We need to know how much health inequality is due to unhealthy lifestyles, how much to a lack of healthcare resources and how much to income inequality.
It is likely that poor health is driving income inequalities rather than the other way round as this evidence shows inequalities in lifespan are much narrower. Is making work work better a more effective way of closing the gap than throwing ever more money into health care?
A greater investment in jobs and skills as well as healthier lifestyles earlier the life course will pay financial as well as social dividends. But spending on prevention needs to increase relative to spending on health care and there needs to be greater regulation of the things that do us harm.
Particularly welcome is the introduction of a phased ban on smoking which will reduce inequalities and save money and lives and restrictions on the advertising of junk food. Other proposed legislation in the King’s Speech will also have a positive impact on people’s health such as the announcements relating to housing, employment and skills.
The ILC’s report One hundred not out: A route map for long lives expands on this analysis, setting out the challenges faced by a growing and ageing population and what solutions are needed to ensure healthier and productive longer lives.
Annex
Table 1: Number of years out of the next five a man can expect to live by age and deprivation decile (England males)
| Male age | Decile | |||||||||
| 1 | 2 | 3 | 4 | 5 | 6 | 7 | 8 | 9 | 10 | |
| 30-34 | 4.7 | 4.8 | 4.8 | 4.9 | 4.8 | 4.9 | 4.8 | 4.9 | 4.9 | 4.9 |
| 35-39 | 4.6 | 4.7 | 4.8 | 4.7 | 4.8 | 4.8 | 4.9 | 4.8 | 4.8 | 4.8 |
| 40-44 | 4.4 | 4.5 | 4.6 | 4.7 | 4.7 | 4.7 | 4.7 | 4.8 | 4.8 | 4.9 |
| 45-49 | 4.2 | 4.4 | 4.5 | 4.5 | 4.6 | 4.6 | 4.7 | 4.7 | 4.7 | 4.7 |
| 50-54 | 4.0 | 4.2 | 4.3 | 4.4 | 4.4 | 4.6 | 4.5 | 4.6 | 4.7 | 4.7 |
| 55-59 | 4.1 | 4.3 | 4.4 | 4.5 | 4.5 | 4.5 | 4.5 | 4.5 | 4.6 | 4.6 |
| 60-64 | 3.8 | 4.1 | 4.2 | 4.2 | 4.3 | 4.4 | 4.4 | 4.5 | 4.5 | 4.6 |
| 65-69 | 3.6 | 3.8 | 3.9 | 4.1 | 4.1 | 4.2 | 4.3 | 4.3 | 4.3 | 4.4 |
| 70-74 | 3.2 | 3.5 | 3.7 | 3.8 | 3.9 | 3.9 | 4.0 | 4.0 | 4.1 | 4.1 |
| 75-79 | 2.8 | 3.0 | 3.2 | 3.2 | 3.4 | 3.6 | 3.6 | 3.6 | 3.7 | 3.8 |
| 80-84 | 2.4 | 2.5 | 2.6 | 2.8 | 2.9 | 2.9 | 3.1 | 3.1 | 3.2 | 3.2 |
| 85-89 | 1.8 | 1.9 | 2.0 | 2.2 | 2.2 | 2.2 | 2.2 | 2.3 | 2.3 | 2.4 |
Table 2: Number of years out of the next five expected to be spent in good health (England Males) by deprivation decile
| Male age | Decile | |||||||||
| 1 | 2 | 3 | 4 | 5 | 6 | 7 | 8 | 9 | 10 | |
| 30-34 | 3.8 | 4.1 | 4.2 | 4.3 | 4.3 | 4.4 | 4.4 | 4.5 | 4.4 | 4.4 |
| 35-39 | 3.6 | 3.9 | 3.9 | 4.0 | 4.1 | 4.2 | 4.3 | 4.4 | 4.5 | 4.5 |
| 40-44 | 3.2 | 3.6 | 3.7 | 3.9 | 4.0 | 4.1 | 4.2 | 4.2 | 4.3 | 4.3 |
| 45-49 | 2.9 | 3.3 | 3.4 | 3.7 | 3.8 | 3.8 | 4.0 | 4.2 | 4.2 | 4.3 |
| 50-54 | 2.5 | 2.9 | 3.1 | 3.3 | 3.5 | 3.7 | 3.7 | 3.9 | 4.0 | 4.1 |
| 55-59 | 2.2 | 2.6 | 2.7 | 3.1 | 3.2 | 3.3 | 3.5 | 3.6 | 3.7 | 3.8 |
| 60-64 | 1.8 | 2.2 | 2.4 | 2.7 | 2.9 | 3.0 | 3.1 | 3.3 | 3.4 | 3.6 |
| 65-69 | 1.5 | 2.0 | 2.1 | 2.4 | 2.6 | 2.7 | 2.9 | 3.0 | 3.1 | 3.2 |
| 70-74 | 1.4 | 1.6 | 1.8 | 2.1 | 2.3 | 2.4 | 2.4 | 2.6 | 2.7 | 3.0 |
| 75-79 | 1.0 | 1.2 | 1.4 | 1.6 | 1.9 | 1.9 | 2.0 | 2.0 | 2.2 | 2.3 |
| 80-84 | 0.8 | 0.9 | 1.0 | 1.2 | 1.4 | 1.4 | 1.5 | 1.5 | 1.6 | 1.8 |
| 85-89 | 0.5 | 0.6 | 0.6 | 0.8 | 1.0 | 1.0 | 1.0 | 1.0 | 1.0 | 1.1 |
[1] See: Levelling up – the great health challenge, Mayhew, Chan, Cairns, 2023. Geneva Papers on Risk and Insurance and ILC’s One Hundred not out: a route map for long lives
[2]Some patients are on multiple treatment pathways. The number of unique patients is estimated to be around 6.3 million Feb24-RTT-SPN-Publication-PDF-only-445KB-08666.pdf (england.nhs.uk)
You can view the full list of countries in our Healthy Ageing and Prevention Index here.
Professor Les Mayhew
ILC's Associate Head of Global Research & Professor of Statistics at Bayes Business School