By: Cesira Urzì Brancati, Helen Creighton, George Holley-Moore, Ben Franklin
The phrase coined by a Clinton campaign strategist during an American Presidential election over 20 years ago still rings true for May 2015. But are there any intergenerational differences in voting motivations?
Our first two blogs have focused on differences in voter turnout between age groups but today we move on to differences in party association and policy priorities between generations. The British Election Study asks voters what is the single most important issue facing the country? Across all age groups one issue comes out top – the Economy. Around one in three voters put the Economy as the top of their list of priorities, placing far more emphasis on it than any other issue.
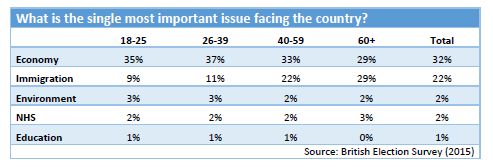
However, the economy is a big catch-all issue which potentially covers everything from the budget deficit and unemployment to wage growth and inflation. Furthermore while voters may agree that the economy is of crucial importance, the policies they believe are needed to fix it vary.
The key variation between voters’ priorities across age groups is with regards to immigration. Less than one in ten 18-25 year olds state that it is the top issue, whereas among voters over 60 it is ranked on par with the economy in terms of importance. Younger voters are more concerned about Scottish Independence (6.4% of the under 25s rank this top compared to 4.7% of the over 60s), Unemployment (6.0% vs 2.8%), and Consumer Debt (3.1% vs 1.5%).
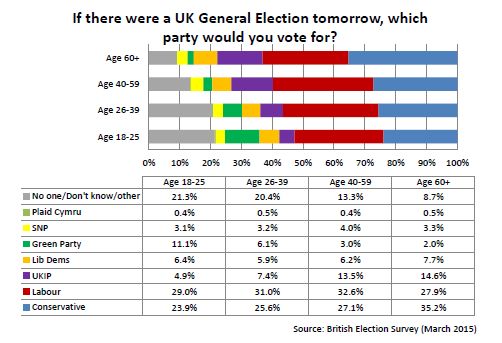
Given these preferences, policy priorities translate into voting intentions much as we would expect. Older voters, with an eye on immigration, state that they are much more likely to vote UKIP or Conservative. Indeed support for UKIP triples as we move from the 18-25s to the over 60s. Younger voters, with socio-economic concerns, are more likely to vote Labour or Green. Support for the Greens is five times higher among the under 25s than it is among the over 60s.
Looking at voting patterns from 40 years ago, it seems little has changed. Back when there was a hung parliament in 1974, just some 17.3% of 18-25 year olds voted Conservative, by comparison to 37.5% of people over 60. By contrast, both then and now, support for Labour has remained more stable across age groups, with variations in the level of support ranging within 10 percentage points.
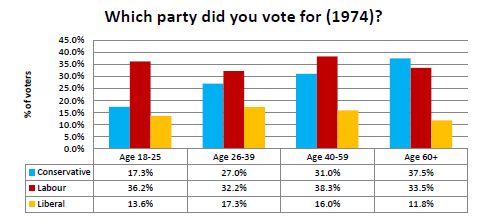
Let’s not forget that those who were 18-25 in 1974 are today’s over 60s. While just 17.3% of them supported the Conservatives then, 34.3% now identify with the blue team. Why do we observe a shift to the right with age? How do people’s economic and social attitudes develop as they age? And what are the implications of this in an ageing society? These are questions for the next addition of the ILC-UK blog…

Cesira Urzì Brancati, Helen Creighton, George Holley-Moore, Ben Franklin
ILC