
The UK is an international outlier – losing workers at younger and older ages
15 Jun, 2026
Ben Franklin, ILC's Deputy Chief Executive, examines why the UK stands out among developed economies for going backwards on both youth inactivity and older worker employment since 2019 – and what the international evidence tells us about the scale of the problem.
Most developed countries recovered their pre-pandemic employment positions after Covid-19. The UK did not. In this analysis – following the publication of Alan Milburn’s interim report on young people and work – we examine the UK's labour market in an international context, focusing on younger and older age groups.
Our analysis of OECD data reveals sustained weakness at both ends of the working-age spectrum: among young people not in employment, education or training (NEETs), and among older adults aged 55–64. Few comparable economies have gone backwards on both simultaneously. In the context of an ageing population, that matters – for economic output, for living standards, and for the sustainability of public services.
Cross-country OECD data show that the UK has seen a much greater rise in NEETs between 2019 and 2024 (latest available) than the OECD or European average. At 13.7%, the UK's rate is above both the OECD average (11.2%) and the EU average (10.0%).
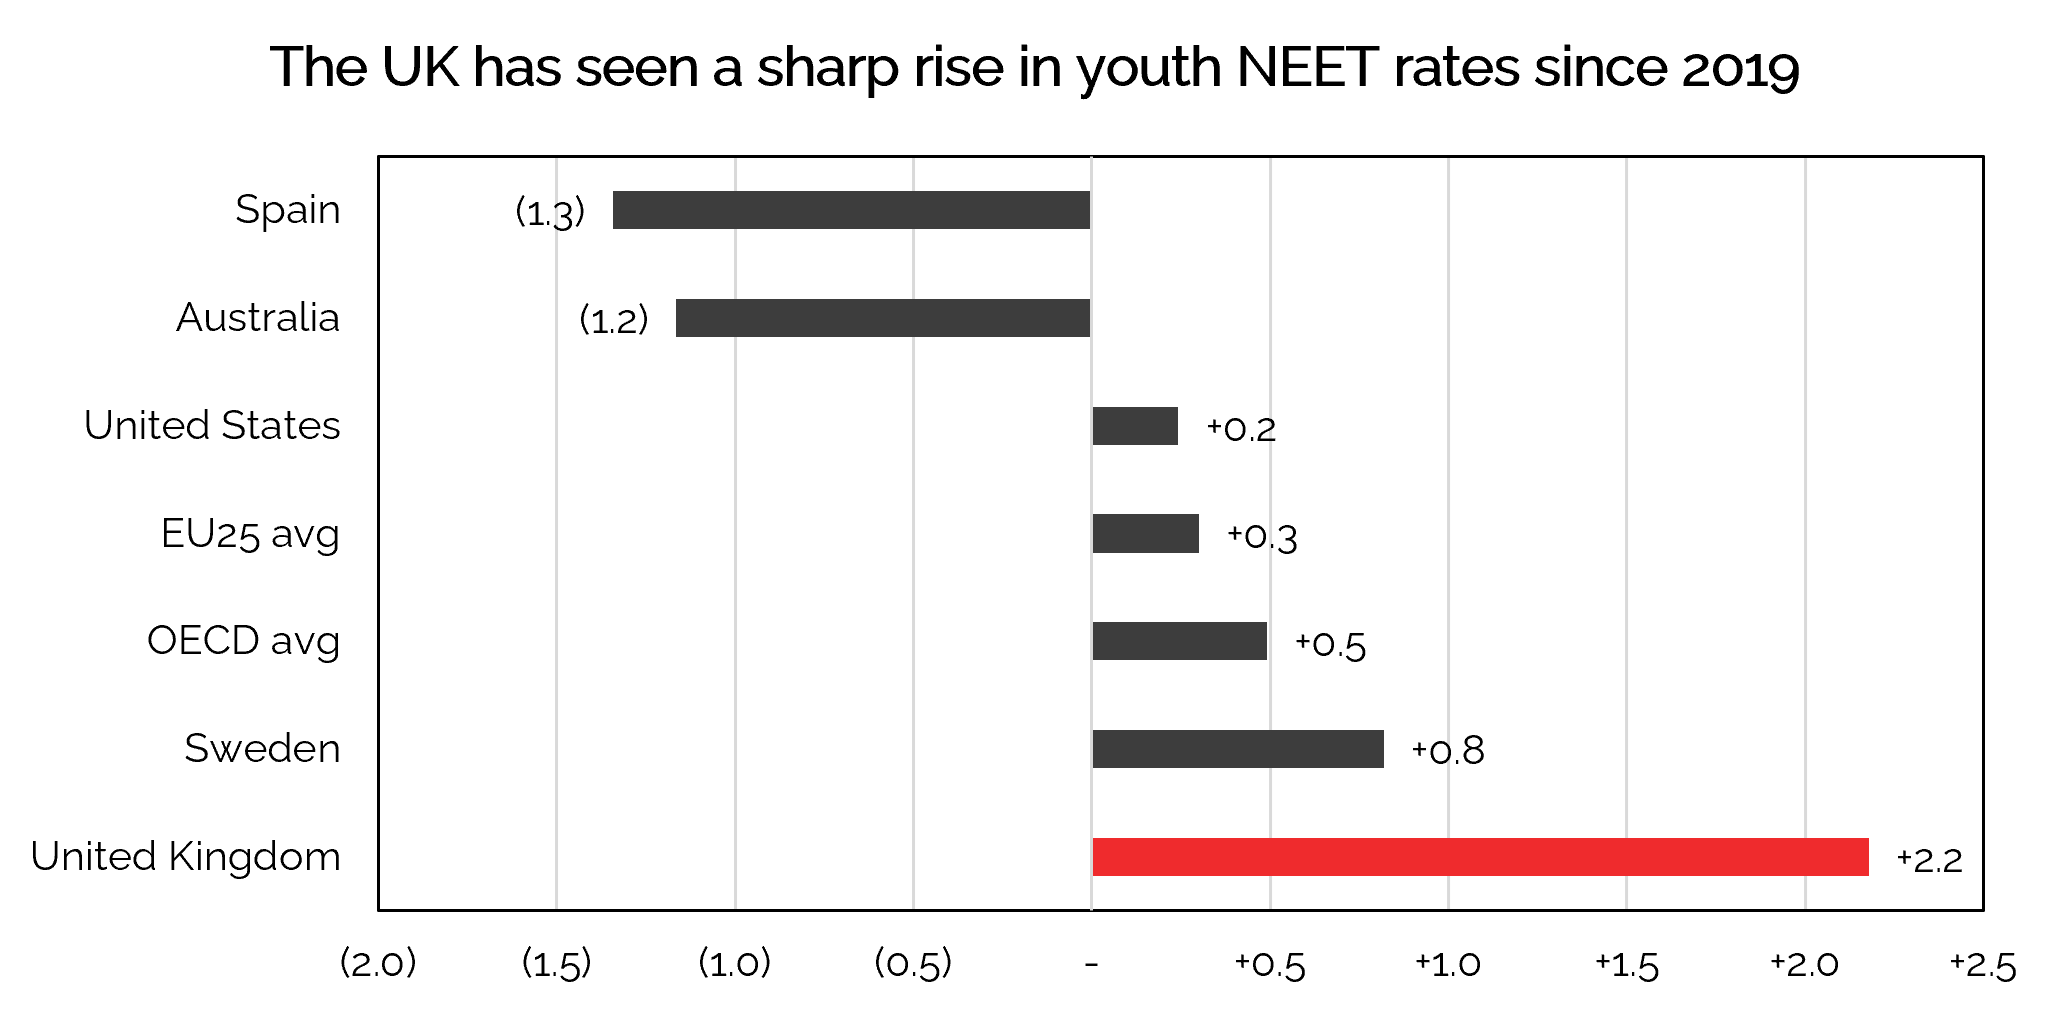
Source: OECD (2025), Distribution of young adults' education and work status, by educational attainment, age group and gender, OECD.Stat. OECD and EU25 figures are unweighted averages
Breaking this down by education level, the picture is more pronounced. Not only are those without A level equivalents more likely to be NEET, but it has become increasingly likely that they will be a NEET since 2019. NEET rates for the least-qualified have risen across the OECD too – this is a widespread problem. But the UK's rise for this group has been far steeper: up 4.5 percentage points since 2019, roughly double the EU average and more than three times the OECD.
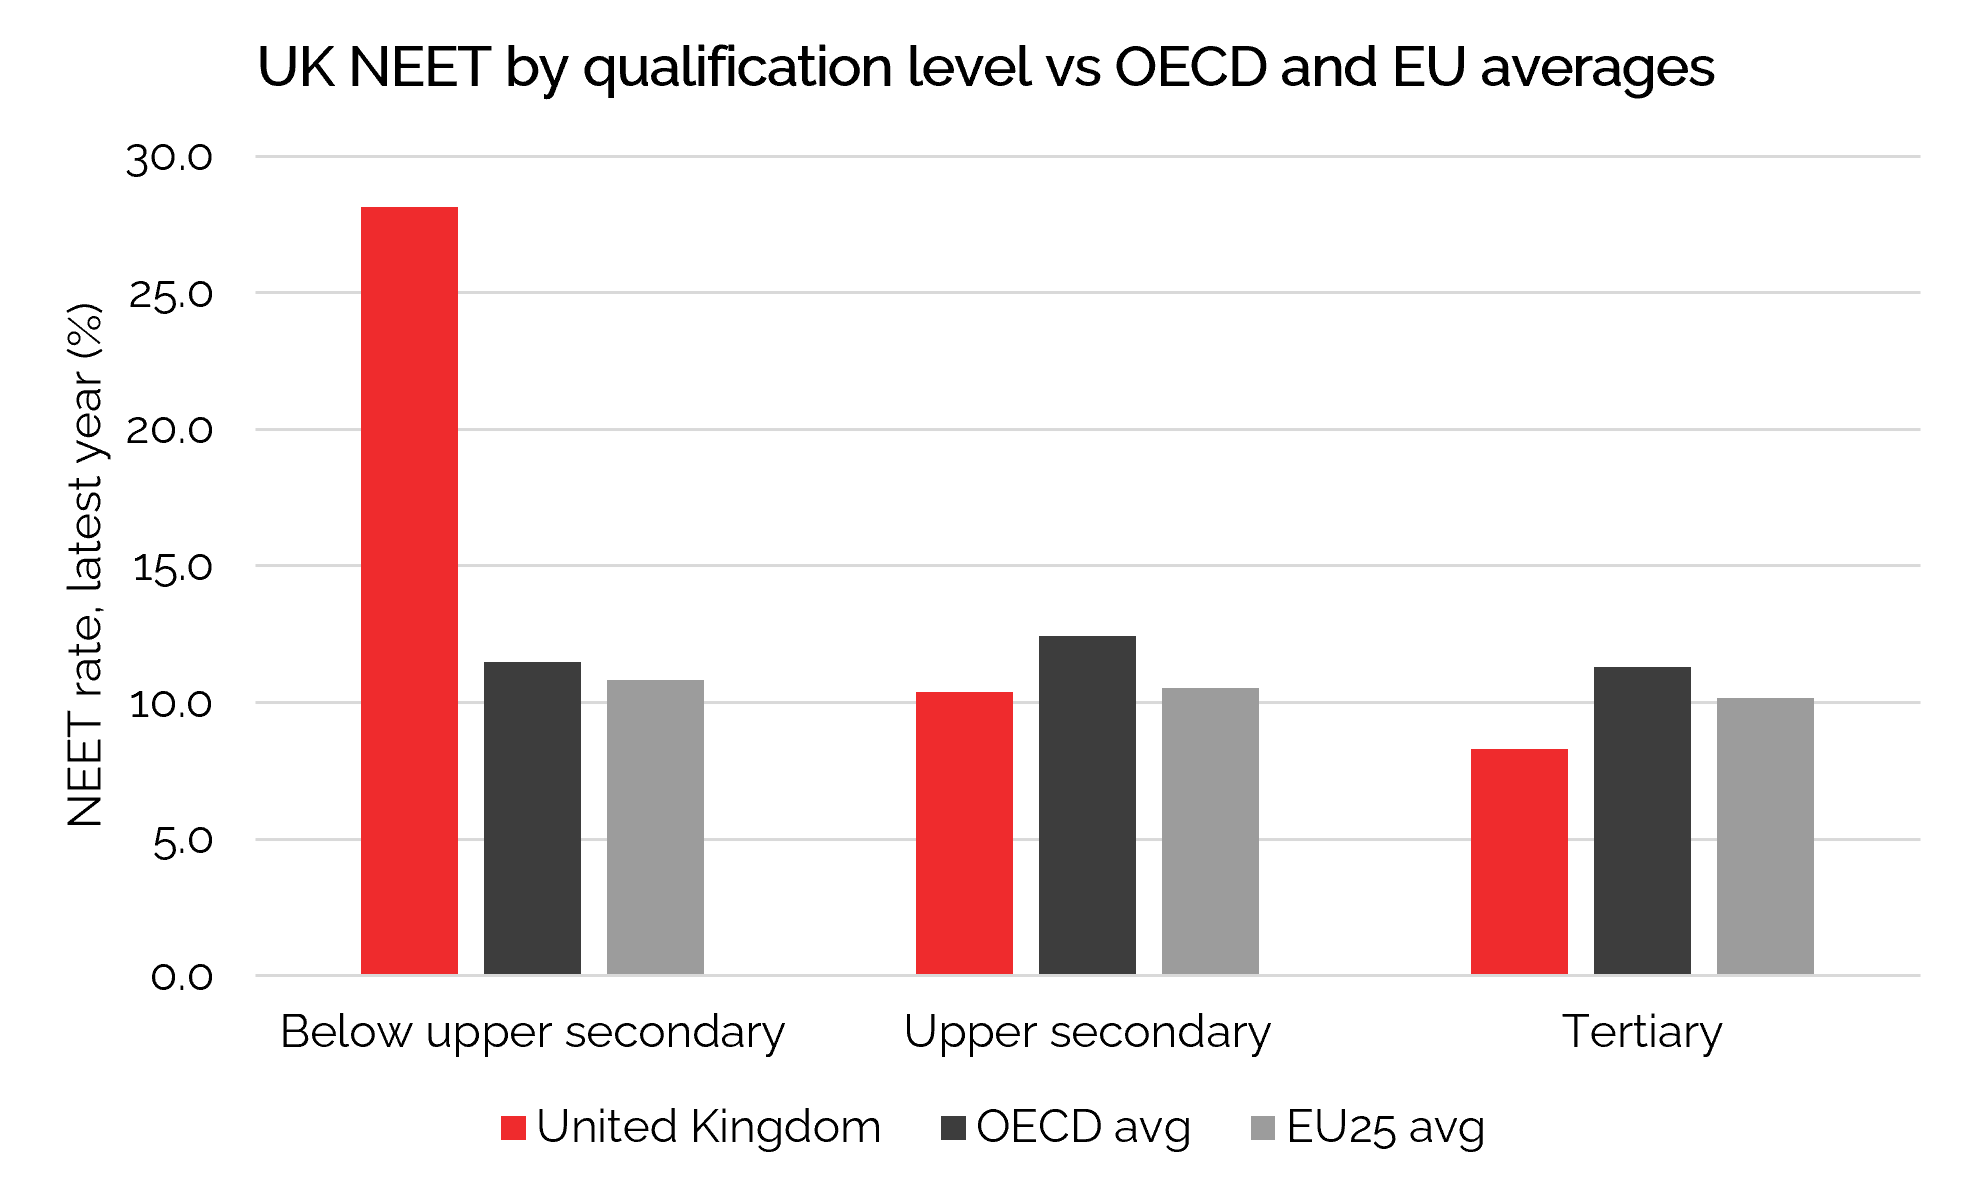
Source: OECD (2025), Distribution of young adults' education and work status, by educational attainment, age group and gender, OECD.Stat. OECD and EU25 figures are unweighted averages
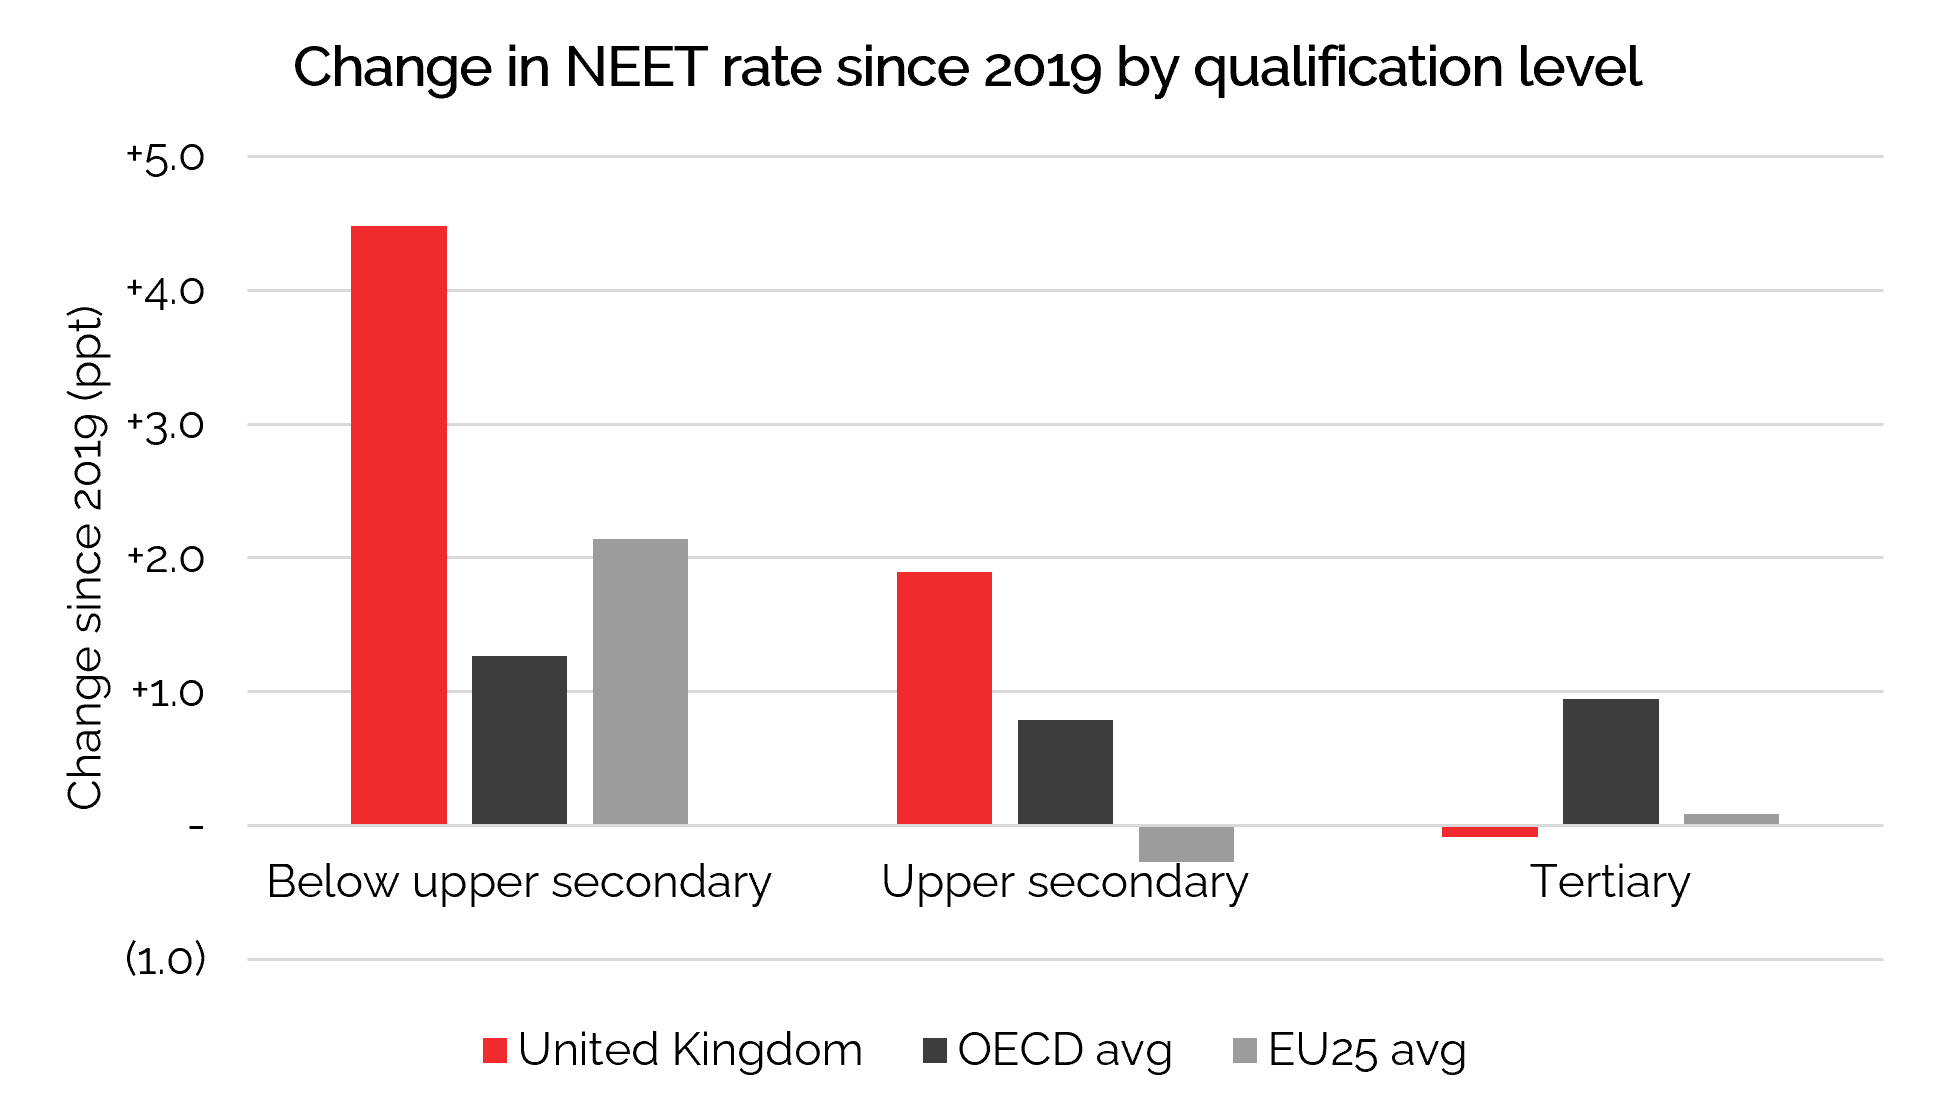
Source: OECD (2025), Distribution of young adults' education and work status, by educational attainment, age group and gender, OECD.Stat. OECD and EU25 figures are unweighted averages
The picture at the other end of the working-age spectrum points in the same direction – though the detail differs. The UK is failing to keep older workers in employment for as long as comparable economies do. Many developed countries have improved employment rates for those aged 55–64 since 2019. In the UK, they have flat-lined. Yet this is not a case of the lagging countries catching up. At 66.2%, the UK's employment rate for 55–64-year-olds is well below Germany (75%) or Japan (79%) – and the gap is widening, as both countries have continued to improve while the UK has not.
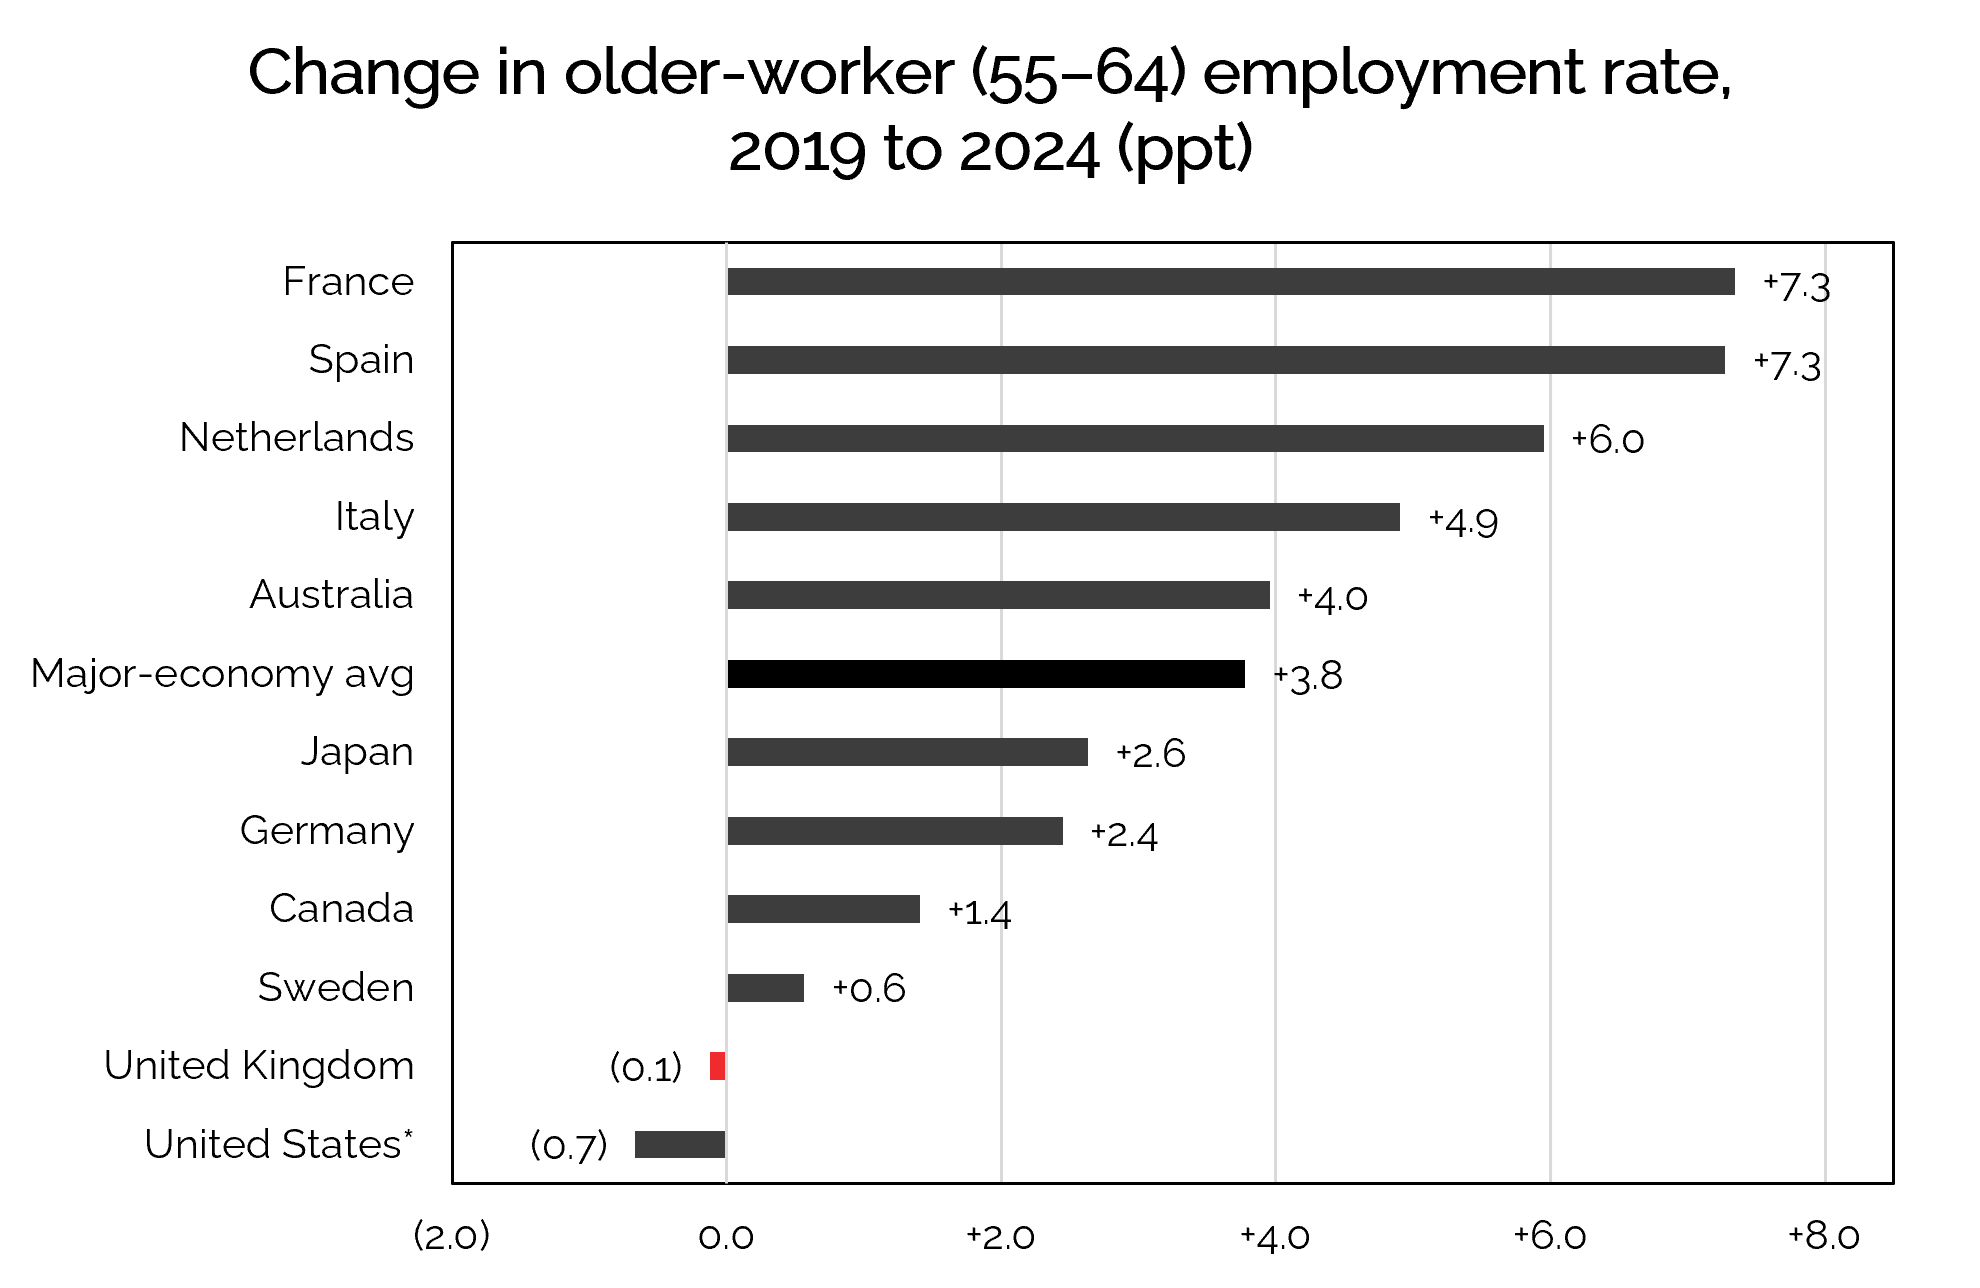
Source: OECD (2025), Employment rates of adults by educational attainment, age group and gender, OECD.Stat. Major-economy average = unweighted mean of the 11 countries shown
In the UK, older workers' employment chances vary significantly by qualification level. The employment rate gap between the most and least qualified 55–64-year-olds is 12.7 percentage points. That is substantially smaller than in France (28.4 percentage points) or Italy (40.6 percentage points), but it still represents significant inequality in who gets to keep working into later life. When it comes to graduates specifically, the UK is falling short of its peers: at 71%, the employment rate for 55–64-year-olds with degrees is well below the best performers, where over 8 in 10 graduates of this age are in work.
Since 2019, the UK has bucked the trend of most peer economies in how employment has changed by qualification level. Several countries saw broad-based improvement. In the UK, employment fell significantly among those educated to A-level equivalent, while those with degrees and those without A-levels saw only small rises.
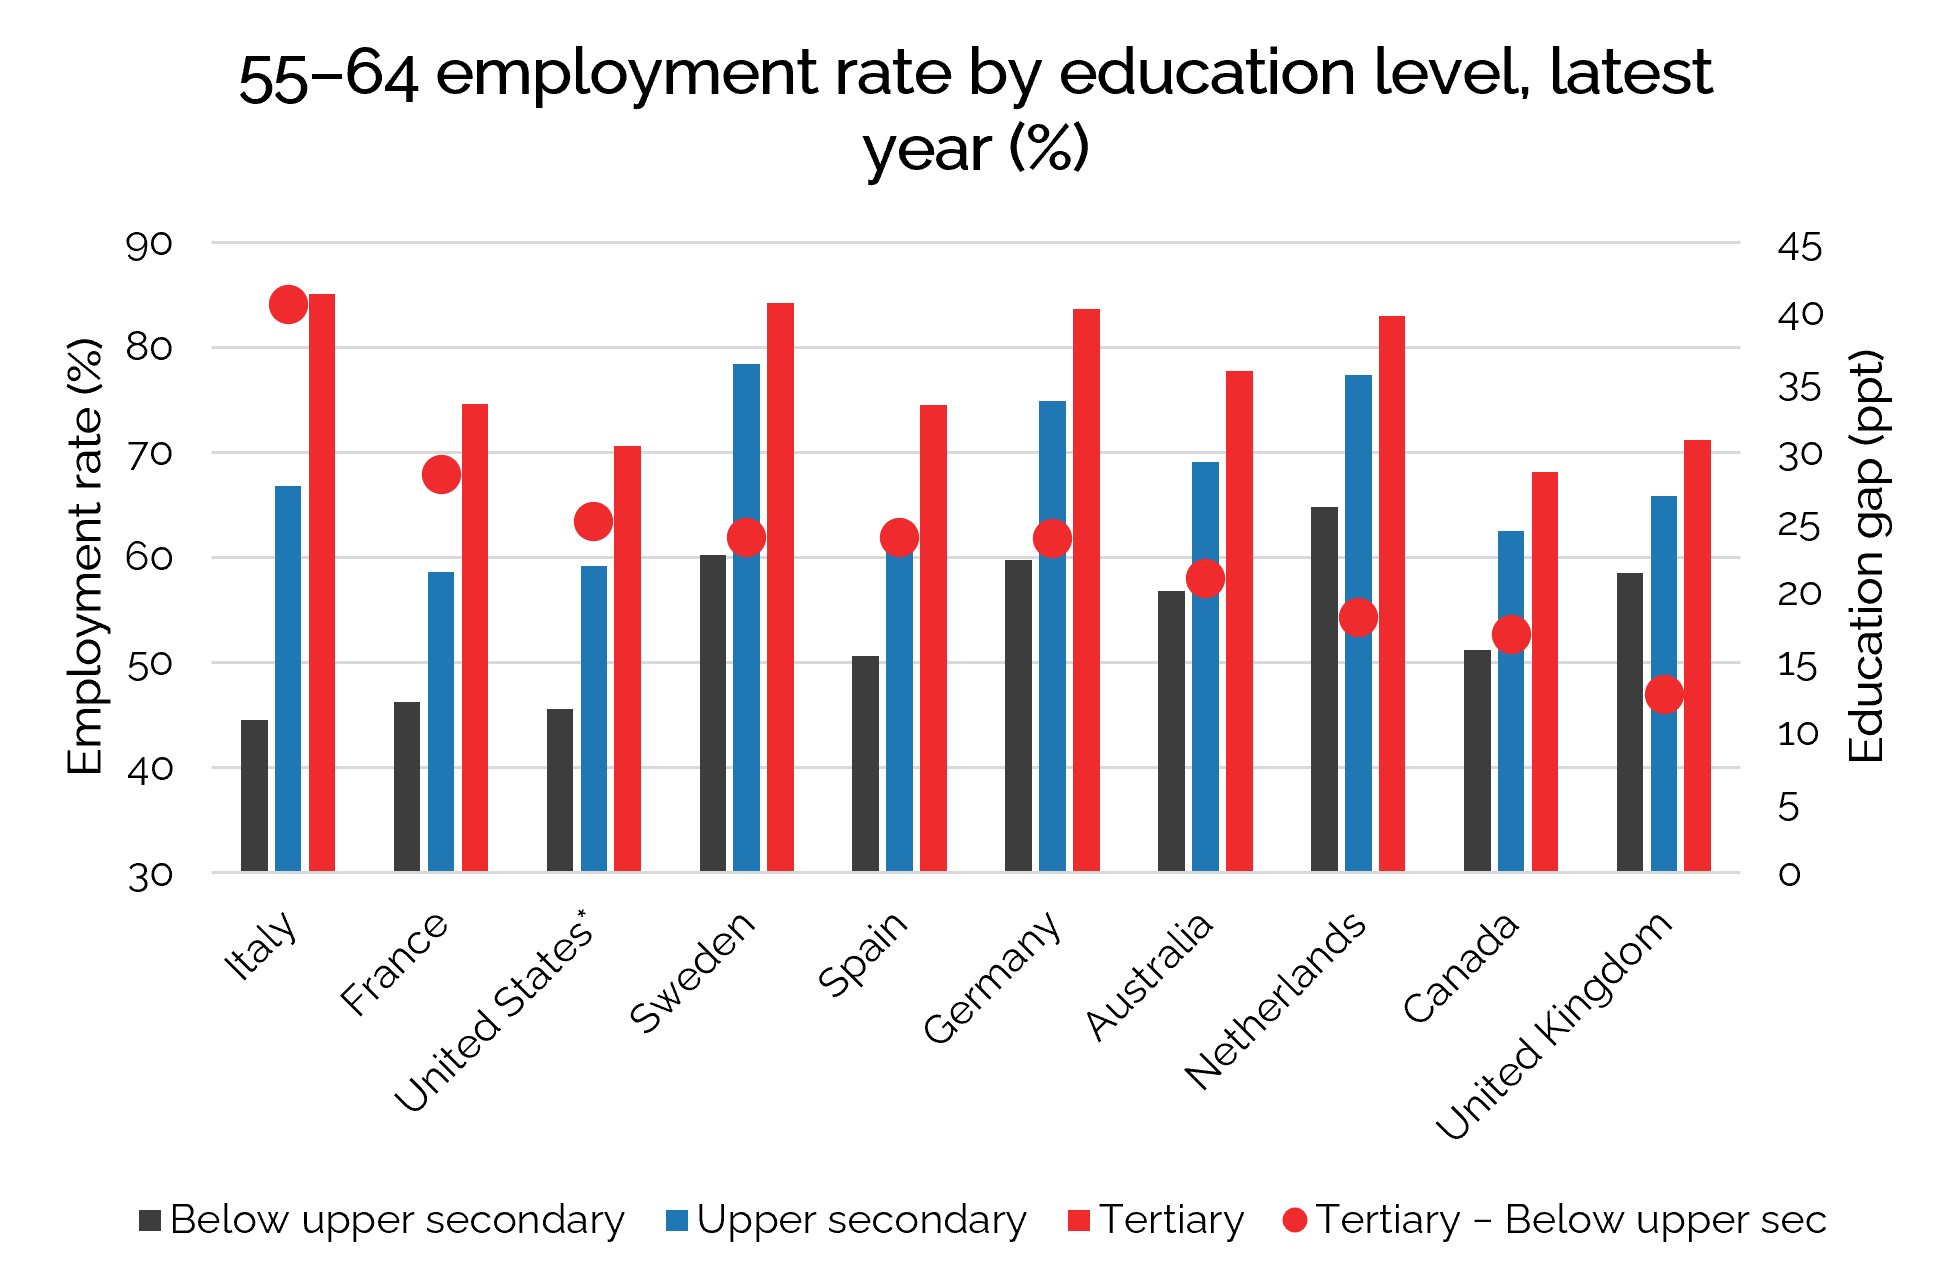
Source: OECD (2025), Employment rates of adults by educational attainment, age group and gender, OECD.Stat.
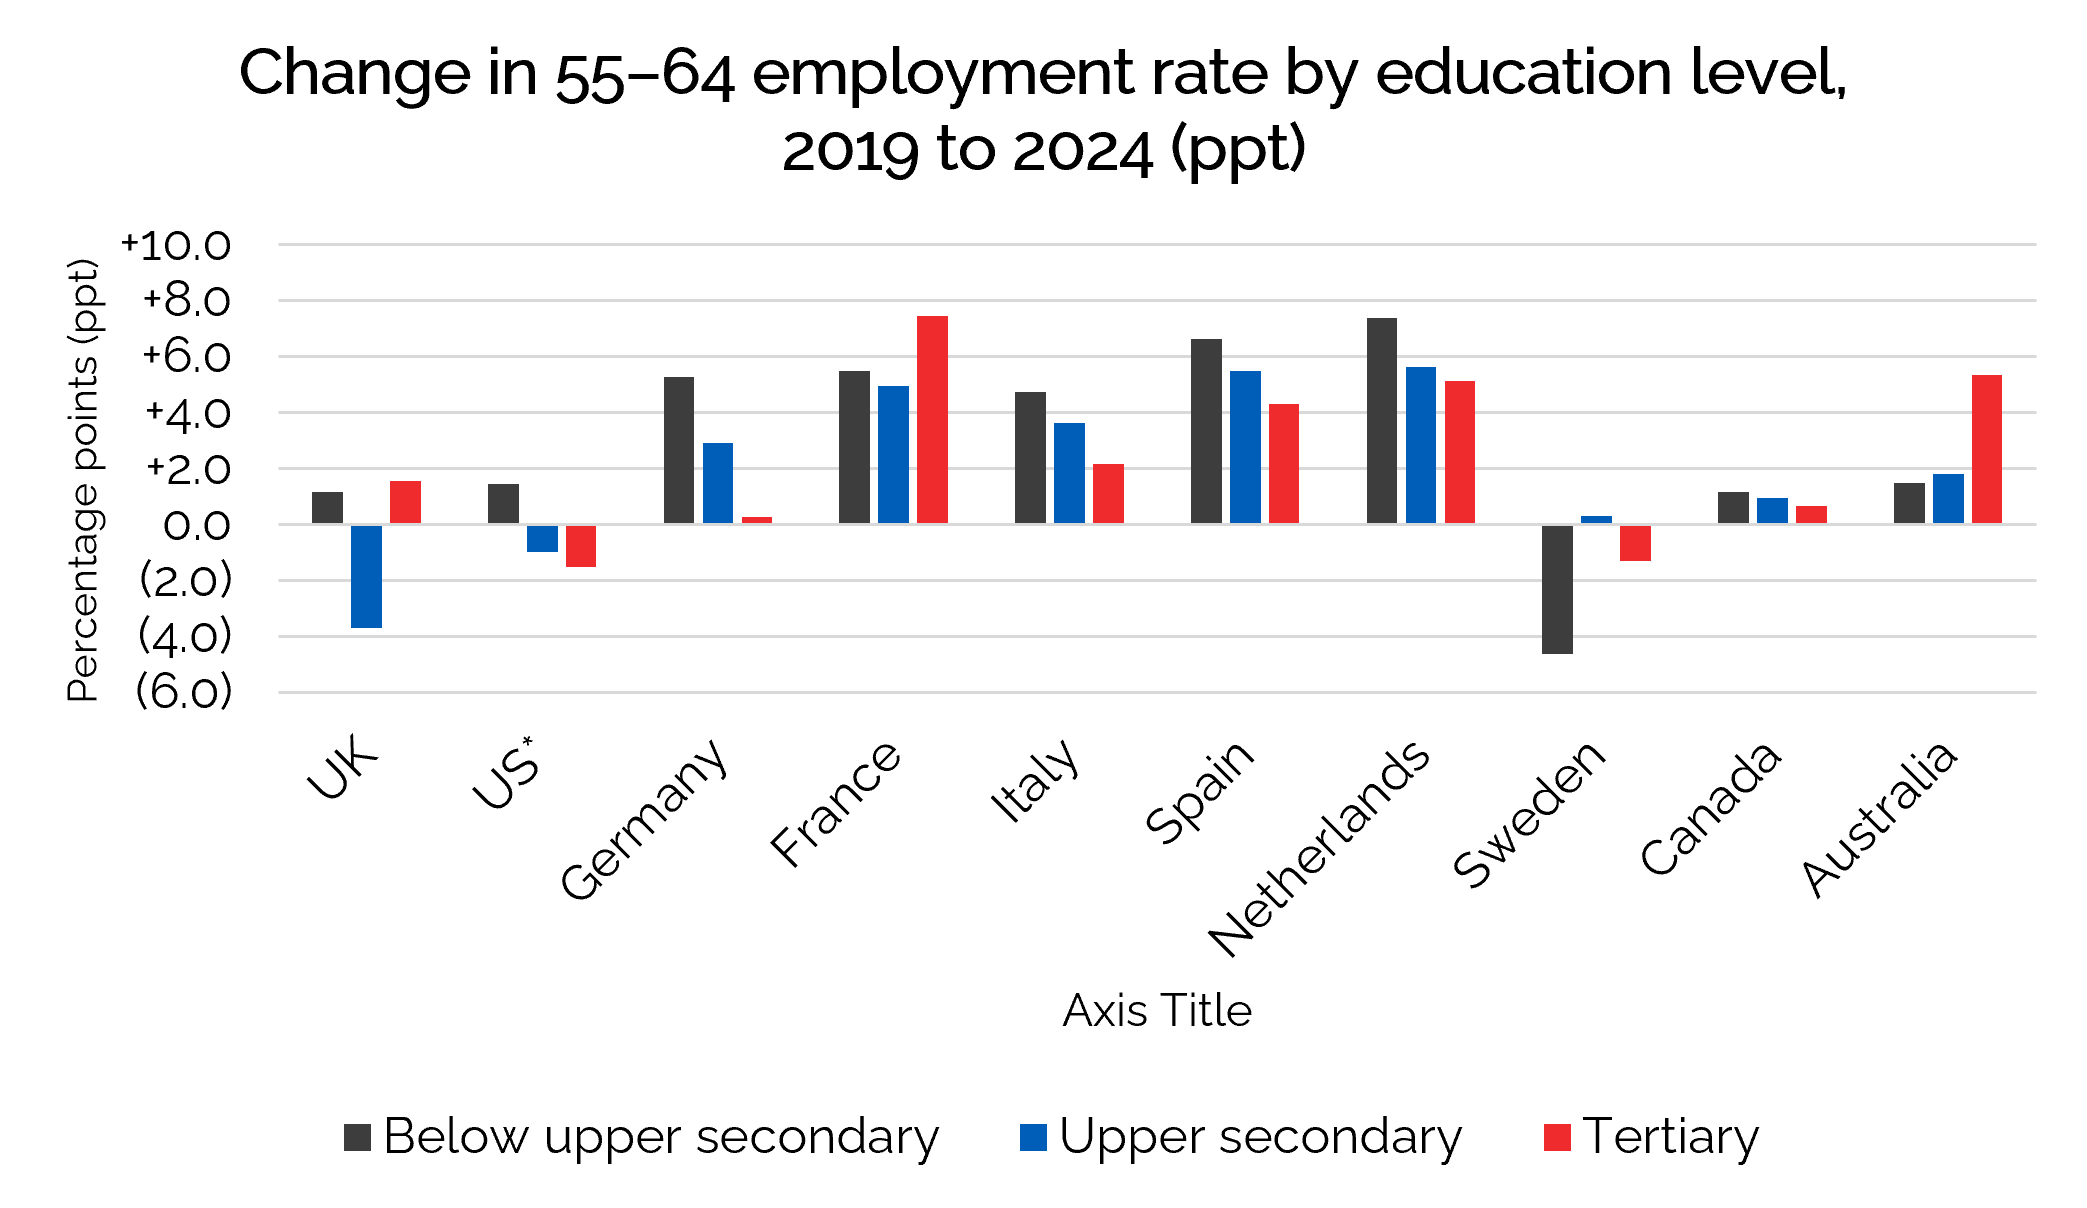
Source: OECD (2025), Employment rates of adults by educational attainment, age group and gender, OECD.Stat. *United States latest available data is 2023 not 2024. Japan is not included as we do not have OECD data split by education status.
Taken together, these findings point to a labour market losing ground at both ends of the working-age spectrum – but in different ways. For young people, the problem is concentrated among those without qualifications: the least-educated are being left furthest behind, and the gap with comparable countries is widening. For older workers, the picture is more nuanced: it is those with intermediate qualifications – A-level equivalent – whose employment has fallen, while graduates and the least-qualified have seen small gains.
What the two groups share is that the UK is underperforming its peers on both fronts, at a time when most comparable economies have moved in the opposite direction. The Milburn review is focused on NEETs – and our evidence reveals something broader: the UK's labour market is failing across the working life in ways that comparable economies are not. That is not inevitable. The international comparisons show there is substantial room for improvement, and that the UK's labour market stagnation since 2019 reflects structural and policy failures rather than forces beyond our control.
Source & notes
- Source: OECD Education at a Glance / Labour-market & Social Outcomes (LSO), employment rates of adults age 55–64, both sexes, all educational attainment levels. Accessed Mon Jun 08 2026.
- Scope: older workers (55–64) only. This dataset has no youth (under-25) data.
- Benchmark: "Major-economy average" is an unweighted mean of the 11 listed economies (UK, US, Germany, France, Italy, Spain, Netherlands, Sweden, Canada, Australia, Japan) — NOT the official OECD aggregate, which has no 2019 value in this dataset.
- United States: endpoint is 2023 (no 2024 data); US change is measured 2019→
- Education levels: Below upper secondary = ISCED 0–2; Upper secondary = ISCED 3–4; Tertiary = ISCED 5–8. Japan has tertiary data only.
- All change figures are in percentage points (ppt) relative to 2019.
Ben Franklin
Deputy Chief Executive
Ben oversees major policy projects and programmes of work for ILC. He is an expert on the intersection of economic and social policy and previously ran the think tank Centre for Progressive Policy, doing ground breaking work on spatial inequality and inclusive growth.
As well as working in think tanks, Ben has worked in the Treasury, Financial Conduct Authority and in the insurance industry.
