
In 2014 one in four families in England & Wales had more than two children – a decade later it’s down to one in five.
5 Jun, 2025
Analysis by the International Longevity Centre UK (ILC) of the latest official birth rate data shows:
- The last decade has seen a 15.1% fall in all live births – from 695,233 in 2014 to 590,274 in 2023.
- Over the same period, there has been a 30.9% decrease in the number of live births in families with at least two previous children.
- As a proportion of total births, one in four babies in 2014 was born into a family with three or more children; by 2023, that had fallen to one in five.

Source: Office for National Statistics (ONS), Births in England and Wales by parents’ characteristics (2014 to 2023)
Over the past two decades, welfare policy for those over pensionable age has been more generously uprated than for those of working age. As a result, child poverty has overtaken pensioner poverty. Economic shocks and increased living costs have been compounded by a tougher welfare regime for younger age groups. This has not only driven rising child poverty, but evidence suggests it has also contributed to the UK’s falling fertility rate – particularly in more deprived areas.
Analysis by the Centre for Progressive Policy of the impact of the 2008–2009 financial crisis and subsequent austerity programme on the UK’s fertility rate showed the decline was significantly more pronounced in socio-economically deprived areas, which experienced a 10% higher annual rate of fertility decline than more affluent counterparts.
As the Resolution Foundation and others have shown, the two-child cap has been particularly damaging to children’s life chances – with its removal estimated to lift 490,000 children out of poverty.
Pensioner and child poverty (relative low income after housing costs)
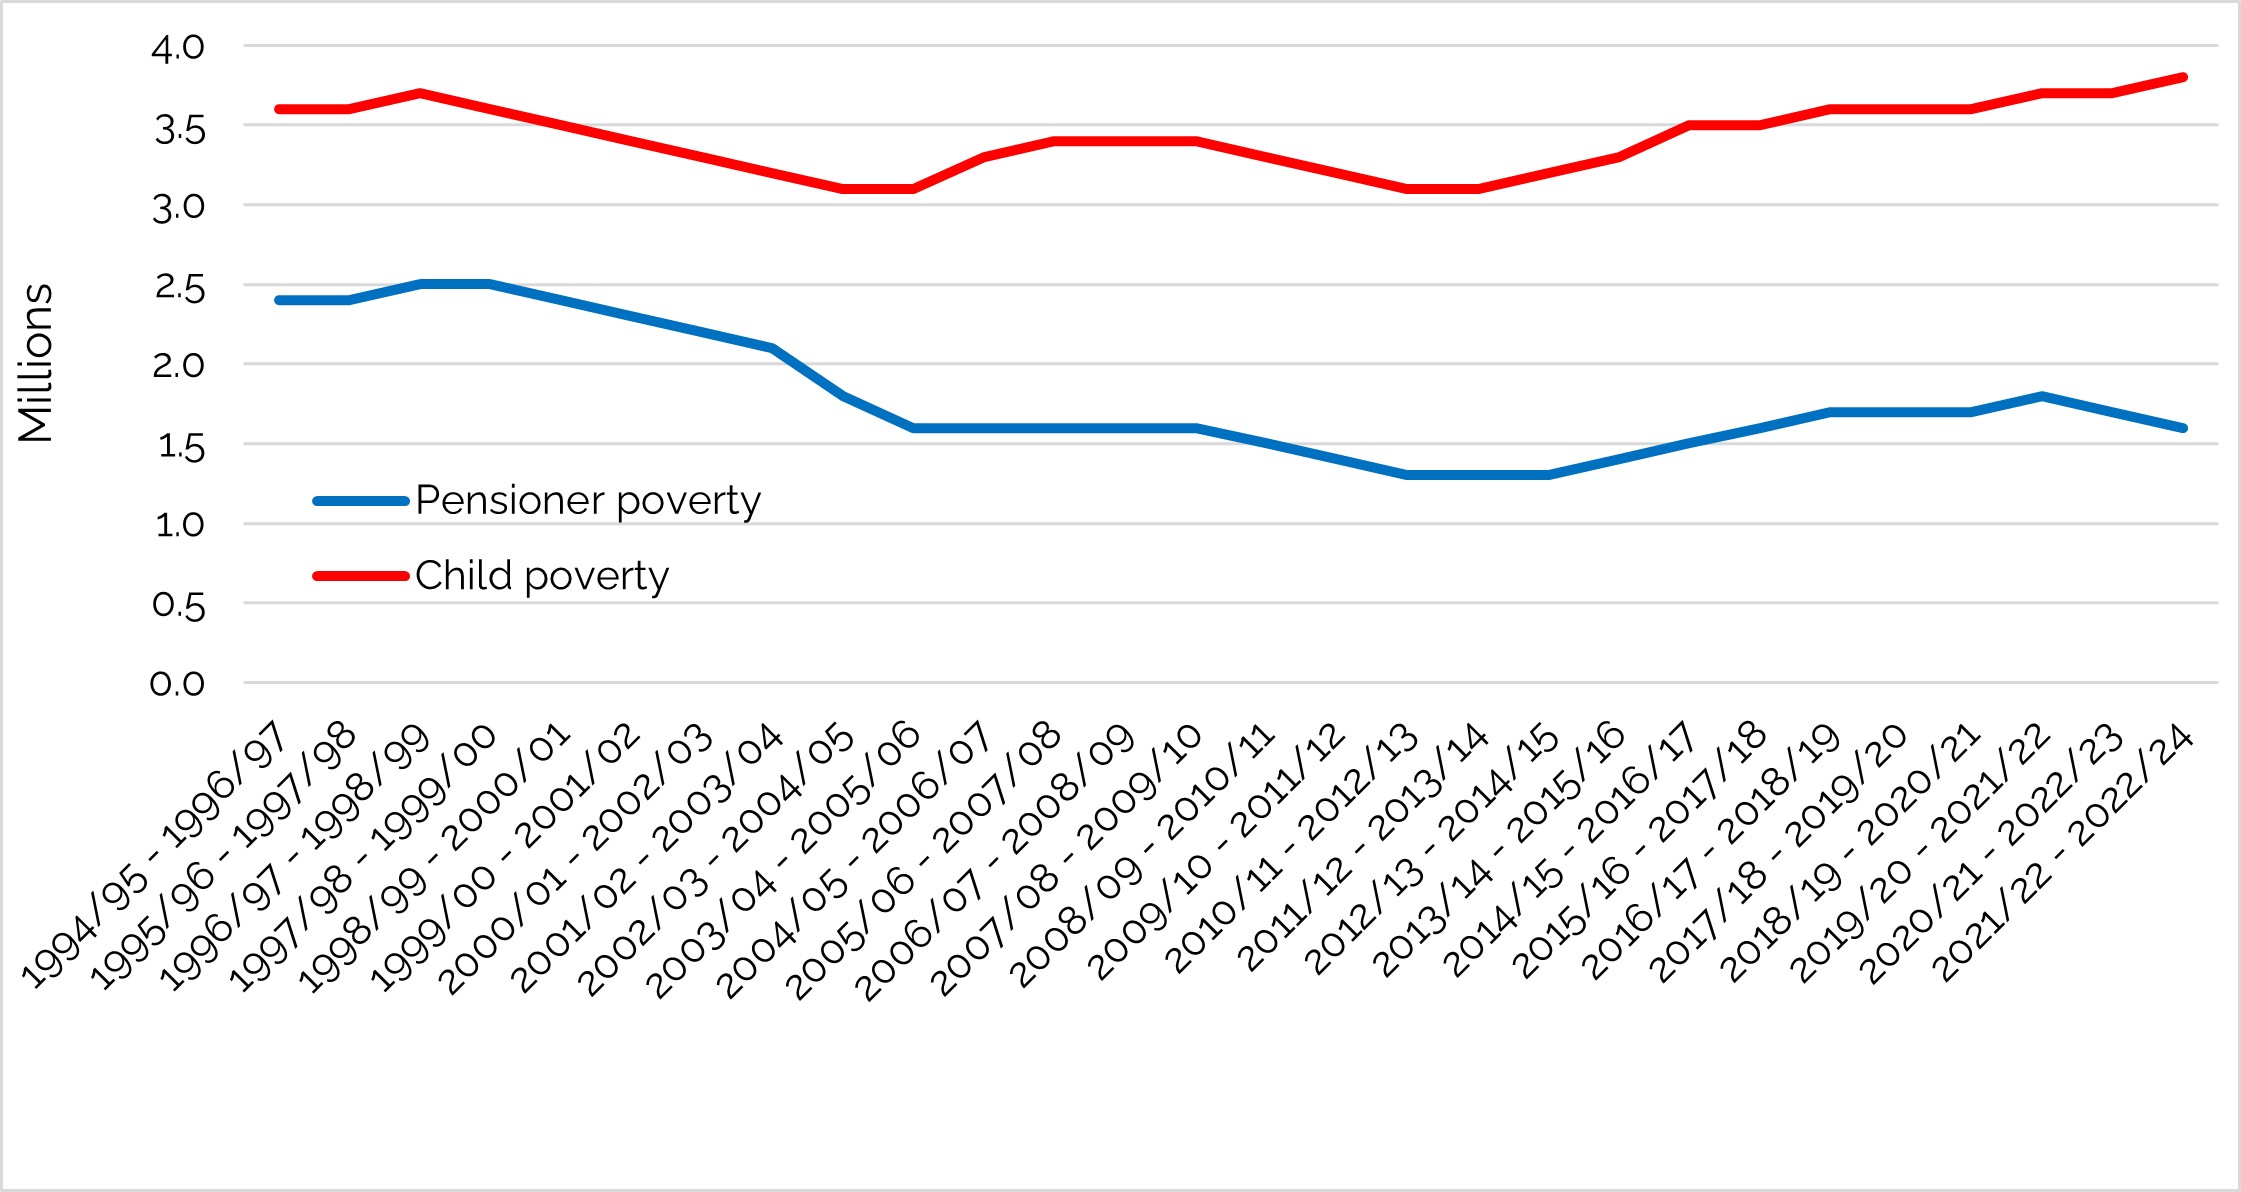
Source: ILC analysis of DWP Households Below Average Income, 1994/5 – 2023/4.
Ben Franklin, ILC Chief Executive, commented:
“If removing the two-child cap significantly reduces child poverty, that should be reason enough to act. While the reasons for falling birth rates are complex, the steeper decline in families with three or more children since 2015 is a striking trend. In an ageing population, this points to further negative long-term socio-economic impacts.”
Ends
Contact
Press@ilcuk.org.uk. Spokespeople are available on request.
Notes
ILC analysis of ONS statistics 2014 to 2023: Births in England and Wales
| Year | All live births | Change in all live births since 2014 | % change in all live births since 2014 | Three or more live births | Three or more live births (% of total) | Change in three or more births since 2014 | % Change in three or more births since 2014 |
| 2014 | 695,233 | 0 | 0.00 | 175,530 | 25.25 | 0 | 0.00 |
| 2015 | 697,852 | 2619 | 0.38 | 173,024 | 24.79 | -2506 | -1.43 |
| 2016 | 696,271 | 1038 | 0.15 | 162,305 | 23.31 | -13225 | -7.54 |
| 2017 | 679,106 | -16127 | -2.32 | 157,057 | 23.13 | -18473 | -10.52 |
| 2018 | 657,076 | -38157 | -5.49 | 147,344 | 22.42 | -28186 | -16.06 |
| 2019 | 640,370 | -54863 | -7.89 | 141,141 | 22.04 | -34389 | -19.60 |
| 2020 | 613,936 | -81297 | -11.69 | 132,441 | 21.57 | -43089 | -24.54 |
| 2021 | 624,828 | -70405 | -10.13 | 134,955 | 21.6 | -40575 | -23.10 |
| 2022 | 605,479 | -89754 | -12.91 | 132,139 | 21.82 | -43391 | -24.72 |
| 2023 | 590,274 | -104959 | -15.09 | 121,355 | 20.56 | -54175 | -30.85 |
Analysis of ONS datasets showing annual live births in England and Wales and number of previous live-born children.
Sources:
- Office for National Statistics (ONS), Births by parents’ characteristics (2014 to 2022 datasets) Births by parents’ characteristics - Office for National Statistics
- Office for National Statistics (ONS), released 28 October 2024, ONS website, statistical bulletin, Births in England and Wales: 2023
- UK’s fertility puzzle: The quest for answers, Centre for Progressive Policy, October 2024
https://www.progressive-policy.net/publications/uks-fertility-puzzle-the-quest-for-answers - Catastrophic caps: An analysis of the impact of the two-child limit and the benefit cap, Resolution Foundation, January 2024
https://www.resolutionfoundation.org/publications/catastophic-caps/ - Households below average income: for financial years ending 1995 to 2024 - GOV.UK