By: Matthew Jones
The ONS has recently released its new 2014 based projections for the UK. Overall the major change since the 2012 iteration of the projections has been the role of net migration, accounting for a greater share of population growth than before.
What does the bulletin show?
The revisions mean a number of things regarding our population growth and our demographic balance. Compared to the 2012 projections, by mid-2024 there will be:
- Around 141,000 fewer births
- 198,000 more deaths
- 502,000 more net migrants.
The population of the UK is also projected to grow to 69.0 million by 2024. This is 249,000 higher than the 2012-based projection for 2024, and is partly due to the base 2014 population being 86,000 higher in the 2014-based projection than in the 2012 projections.
The population as of June 2014 was estimated at 64,596,800, therefore by 2024 they expect an increase of approximate by 4.4m people, an increase of 6.8% over the period. By 2039 it will have increased by 9.7m, an increase of 15% from 2014.
Revisions
Revisions have been made to fertility (in Scotland) but the long-term assumption of fertility for the UK principal projection is unchanged from the 2012-based projections at 1.89 children per woman. Mortality is also unchanged.
The major change therefore comes from the projections for net migration. As can be seen the principle migration figure, as well as the high and low migration estimates, have been revised up by around 30,000 per year. For the principle figure this is an 18.8% increase on the 2012 projection.
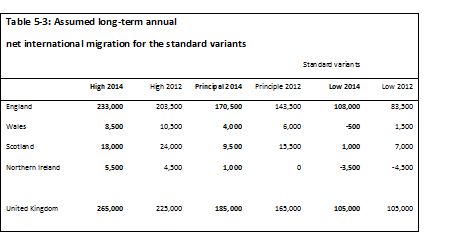
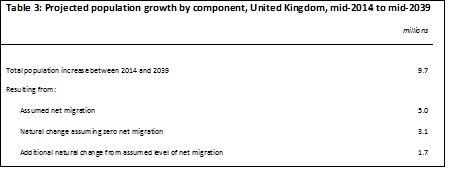
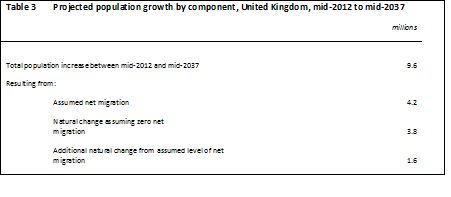
Whilst the proportion of population increase attributable to migration has increased, natural population growth (i.e. growth without net migration) has been revised down. This is due in part to a reduction in births and an increase in deaths amongst the population. The migration predictors are listed below; the two tables show the difference between the 2012-37 projections from 2012 and the 2014-39 projections from 2014. As can be seen there is a large positive change in the contribution of assumed net migration and a decline in the contribution of natural change. The overall population increase however remains at similar levels.
Source: ONS
Projected dependency ratios
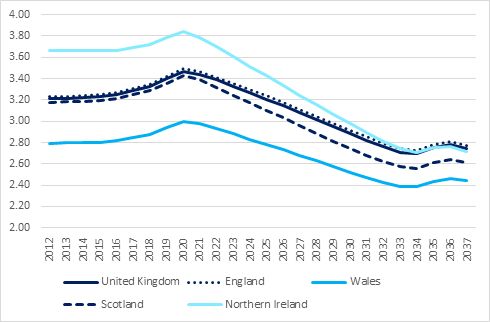
Figures for the ratio of numbers of working people to pensioners and the numbers of older dependent people highlight the demographic challenges ahead as well as the impact of change to the State Pension age. As can be seen in Figure 3, changes to the State Pension age means there will actually be an increasing number of younger people for every person over State Pension age during the period up to 2020 before the trend reverses the number of younger people for every older person significantly declines until further anticipated changes to the State Pension in the mid-2030s. Given the projections from the ONS it will interesting to see how future changes in net migration will impact these ratios, especially given that the bank of England regards the number of future migrants as “uncertain”.
Source: ONS
In summary, the projections show that the population is increasing at a somewhat faster rate than previously anticipated, and that this faster increase is mainly down to increased levels of migration. But migration flows are volatile making it difficult to accurately project population growth in the future. The projections also show the potential impact of changes to State Pension age which has a pronounced short term effect on the dependency ratios across the UK but cannot, in themselves prevent a rise in dependency over the longer term.
Matthew Jones
Research and policy intern
Matthew Jones was a research and policy intern at the ILC from September 2015 to February 2016.