Counting the cost of inequalities
By: Prof Les Mayhew
There is huge policy interest in levelling up disadvantaged areas, but what does it mean and is it just about equality of income? There is an abundance of evidence that health and longevity are closely linked to GDP, productivity and public expenditure.
That might sound obvious, but not much quantitative research has been done on the connection. Showing how they are intertwined has the potential to help us re-imagine these issues, but why is it so difficult?
Kenneth Galbraith, the US economist, said that if you stuff enough oats into a donkey enough will come out at the other end to feed the sparrows. A great quote but it assumes that all sparrows are equal – which obviously is not the case.
In this blog, I describe a new approach that addresses this issue head on. Though still experimental, it has potential for re-imagining these issues. It is based on a new report: ‘Counting the cost of inequality – putting a price on health’. In particular, it leads to a single easy to understand index of inequality – the first of its kind addressing this issue.
To contextualise a bit further we also have a Government target of increasing healthy life expectancy by 5 years by 2035 (though this hasn’t been mentioned since February 2020). Meanwhile the population is ageing rapidly. It shows that government now takes health seriously, but there are serious questions about how achievable this would be and what the impact would be on the wider economy.
A key problem is that there is no simple measure that links health on the one hand to economic advantage or disadvantage on the other. My starting point is to put health centre stage. I argue that health drives life expectancy and also drives working lives. Self-evidently, healthy lives are shorter than completed lives but the data also shows that working lives are shorter than healthy lives, indicating that poor health is a work-limiting factor.
Intuitively this is correct, but there are unanswered questions. For example, does poor health shorten working lives more than it shortens life expectancy? If so, we would be in trouble. More taxes would have to be raised to pay for health, welfare and pensions because more years would be spent in poor health than in work.
For example, exiting the workforce at age 55 through ill health is economically more damaging than exiting at age 60 because 5 years of output are lost. Will raising the state pension age do any good if people are in poor health and can’t work? We need a method that reflects both the direct costs of poor health and also the opportunity costs of lost output.
How it works
This is how it works. For each district we compute working lives, healthy years, and unhealthy years (all of this data, by the way, is available from the ONS via labour force and annual population survey and life tables). In essence we add up the cost of health, welfare and pensions and then express their value as a tax on economic output.
We then sort districts into groups based on whether they are high, medium or low on each of work, health and life span. For example, an area, which is high on all three would be labelled triple H and an area which is low on all three is labelled triple LLL. L is for being in the bottom quartile, H (the upper quartile) and M (medium i.e. in between).
Next, we split adult life span (age 20+) into states such as the average number of economically active healthy life years, or the number of unhealthy retired years. We then estimate the total cost of public expenditure in each state for every district before adding the costs together.
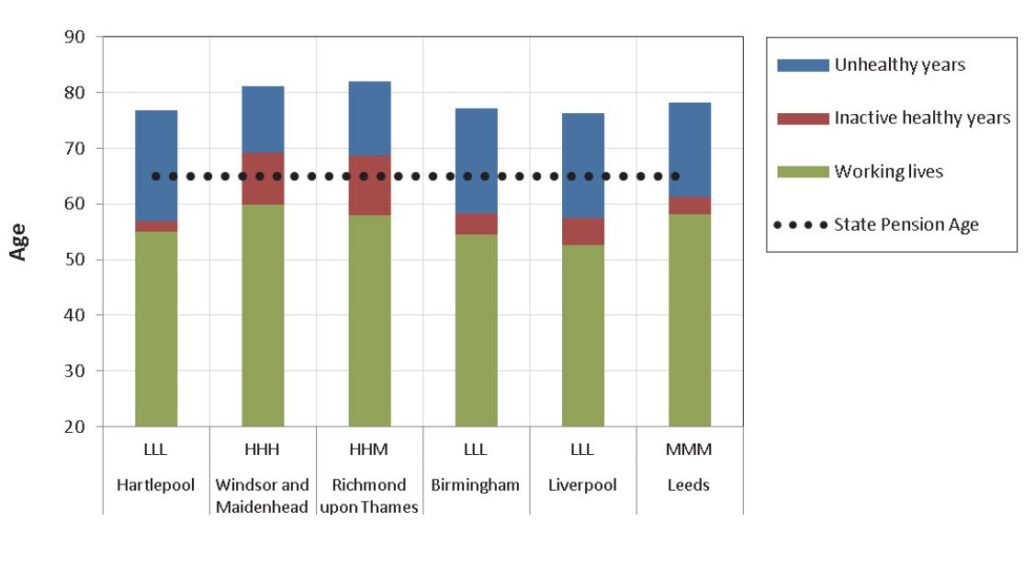
Among the 150 districts of England, we find huge variation. It’s much easier to see it on a chart – see Figure 1. The height of each column represents life span divided into three phases – working life, economically inactive healthy years and unhealthy years towards the end of life.
You will see the bar codes on the charts against each district. For example, Richmond upon Thames is HHM i.e. it has high life and also health expectancy, but working lives are only of medium duration. The full report lists them all. Interestingly, not all of 27 different code combinations occur in practice. In general, it confirms the theory that work is good for health and that health is good for wealth,
The most common are triple HHH, triple MMM and triple LLL, accounting for 42% of the districts analysed. The HHH category mostly includes districts in the wealthier south-east of England. The MMM category includes districts such as Leeds, Medway, Greenwich and Cornwall, and is more spread out. The LLL category includes parts of Manchester, Birmingham and Liverpool.
There is a huge variability in life courses and in the scale of inequalities. For example, the top and bottom 5% of English districts have a 12-year difference in average health span and a 6-year difference in average working lives. In 97% of districts work span is less than health span. On average, richer districts both work longer and have more inactive healthy years.
In Hartlepool (LLL), for example, around 21.7 years are spent post-work, but only 1.9 of those are healthy. In Richmond upon Thames (HHM), post-work inactive years last just over 24 years of which 10.8 are healthy. Richmond also lives longer.
Across the country, an adult man in the LLL category can expect to live to age 77 with 20 years in impaired health, but for a man in the HHH category it is 81 years with only 13 years in impaired health. A dotted line representing state pension age shows that healthy lives often fall well short of what is needed – in fact in 72% of all districts.
Figure 1: Examples comparing individual districts based on work, health and life-pan. The hatched horizontal line shows state pension age.
To create the index itself we need to know the number of years spent in each ‘life state’ and the cost to the public purse of being in that state. [For further details see the full report, link below]
We find that the overall average tax rate is 26% of income, but this ranges from 21% to 34% at the district extremes. To be clear, this index doesn’t mean that the poorest areas should be taxed more. What it shows is that the most economically disadvantaged have the highest imputed taxes and vice versa.
The main findings
Here we come to some of the main findings of the research. Scenarios shown in Table 1 vary from a decline of two years in healthy life expectancy to a rise of 5 years – the government’s target. I’ve done this because a fall in health expectancy is not an unrealistic possibility given the COVID crisis.
Table 1: Illustrative examples of changes in life and work span, tax rates and inequalities from general increases in HLE based on figures from birth
| Change in HLE at age 20 (years) |
Average age at end of : LE |
HLE | WLE |
Change in LE from baseline |
Change in WLE from baseline | Tax% |
Inequality (standard deviation +/- % |
| -2 | 78.4 | 60.7 | 57.1 | -0.8 | -0.4 | 27.67 | 3.04 |
| -1 | 78.8 | 61.7 | 57.3 | -0.4 | -0.2 | 27.03 | 2.98 |
| Baseline | 79.2 | 62.7 | 57.5 | 0.0 | 0.0 | 26.42 | 2.90 |
| 1 | 79.6 | 63.7 | 57.7 | 0.4 | 0.2 | 25.86 | 2.80 |
| 2 | 79.9 | 64.7 | 57.9 | 0.8 | 0.4 | 25.35 | 2.69 |
| 3 | 80.3 | 65.7 | 58.0 | 1.1 | 0.6 | 24.88 | 2.59 |
| 4 | 80.7 | 66.7 | 58.2 | 1.5 | 0.7 | 24.44 | 2.49 |
| 5 | 81.1 | 67.7 | 58.4 | 1.9 | 0.9 | 24.04 | 2.40 |
Using the empirical relationship between life, health and work span, I am able to estimate the impact of an improvement in health on completed lives and working lives, imputed taxes and also on inequality itself by using the standard deviation in tax rates as my measure.
It shows that a one-year increase in health would translate, on average, into an approximate 4.5 month increase in life expectancy. A one-year rise in healthy life expectancy would, in turn, generate an increase in working life expectancy of roughly 3.4 months.
If you think about it, the rise in health span cannot be greater than the rise in lifespan so this is intuitively correct. One benefit is that a smaller gap between health and life span would lower health costs but pension costs would rise as people live longer as public expenditure is shunted forward to the end of life.
The increase in working lives would increase economic output, reduce welfare costs and increase the tax base. This in turn could create the headroom for an increase in state pension age which would save on public expenditure or allow for higher pensions.
However, we can see that the effect of an increase in health on inequality is quite small. This is because, across the board, improvements in health benefit all districts pro-rata. So, in order to have a greater effect, one would need to target the more left behind areas with special measures.
Relationship between health and GDP
GDP, or gross national product, is widely used to measure and compare economies – ditto GDP per head. We know it has significant limitations – for example it does not include the value of unpaid work, which is important in ageing populations like ours.
The question for us is whether just increasing GDP on its own would solve the inequality puzzle? For the UK, earned income is ~50% of GDP and unearned income (rents, dividends etc.) the other 50%. Current value is about £2.1 trillion.
If all wealth is generated by earned income, then all economically active persons and households will benefit – especially if productivity increases. Increased GDP from unearned income tends to go to people and households who already have independent wealth – homes, pensions etc.
For example, rising house prices increase wealth and rents but widen inequalities between owners and non-owners. Conversely the investment of large pension funds (i.e. private wealth) in infrastructure and human capital is a great way of investing private wealth for the benefit of all.
Hence investing private wealth is a crucial tool in reducing the inequality gap and should be encouraged – the question then becomes what works in policy terms. This is a huge issue for another time because it also touches other things like low productivity and even the future of work itself.
What happens next?
This research presents a novel way of thinking about inequalities across the life course tackling issues that normally reside in different policy silos. Although the method is still experimental, in effect we have redefined the ageing process by health states rather than by using arbitrary age cut-offs to partition life-span.
The results so far show that a health improvement would lift all areas but not necessarily reduce the gaps. More targeted measures are needed for that. But improved health would help improve the quality of public services and create the headroom for working longer, which is important in an ageing population.
So what about the government target of increasing HLE by 5 years by 2035? Looking back on the global data the only countries to have achieved an increase of this size were South Korea, India and Russia between 2000 and 2015. These are not perhaps the best models to follow.
The UK improved 2.9 years and Japan the leading country on HLE only by 2.3 years. Both started from a higher base so it means it gets harder to achieve the more successful you are. COVID has caused life expectancy to decline – which is a further set back.
I conclude that while the aim is great, its achievement in the time scale is sadly unlikely – even before COVID struck. That doesn’t diminish its importance as I have argued but I would expect the government not to mention it again in future.
See the full report, ‘Counting the cost of inequality- putting a price on health’ here.
Prof Les Mayhew
Head of Global Research, ILC
Les joined ILC in October 2020 as Head of Global Research and will be working on a range of ILC research projects as well as enhancing our research approach and strategy.
Les is also part-time Professor of Statistics at The Business School (formerly Cass), City University, London, and Managing Director of Mayhew Harper Associates Ltd. His previous experience includes 20 years in the Department of Health and Social Security, the Department of Social Security, HM Treasury and the Office for National Statistics, where he was a director. He is an alumnus of the International Institute for Applied Systems Analysis (IIASA), Vienna, an Honorary Fellow of the Institute of Actuaries, and a member of the Royal Economic Society.