Delivering better, longer lives in hard-up places is the political challenge of our times
22 May, 2026
New analysis of the 2026 local elections in England by the International Longevity Centre UK (ILC) highlights the extent to which voters have turned away from the two dominant parties of modern British politics – particularly in areas where growing up and growing old is hardest.
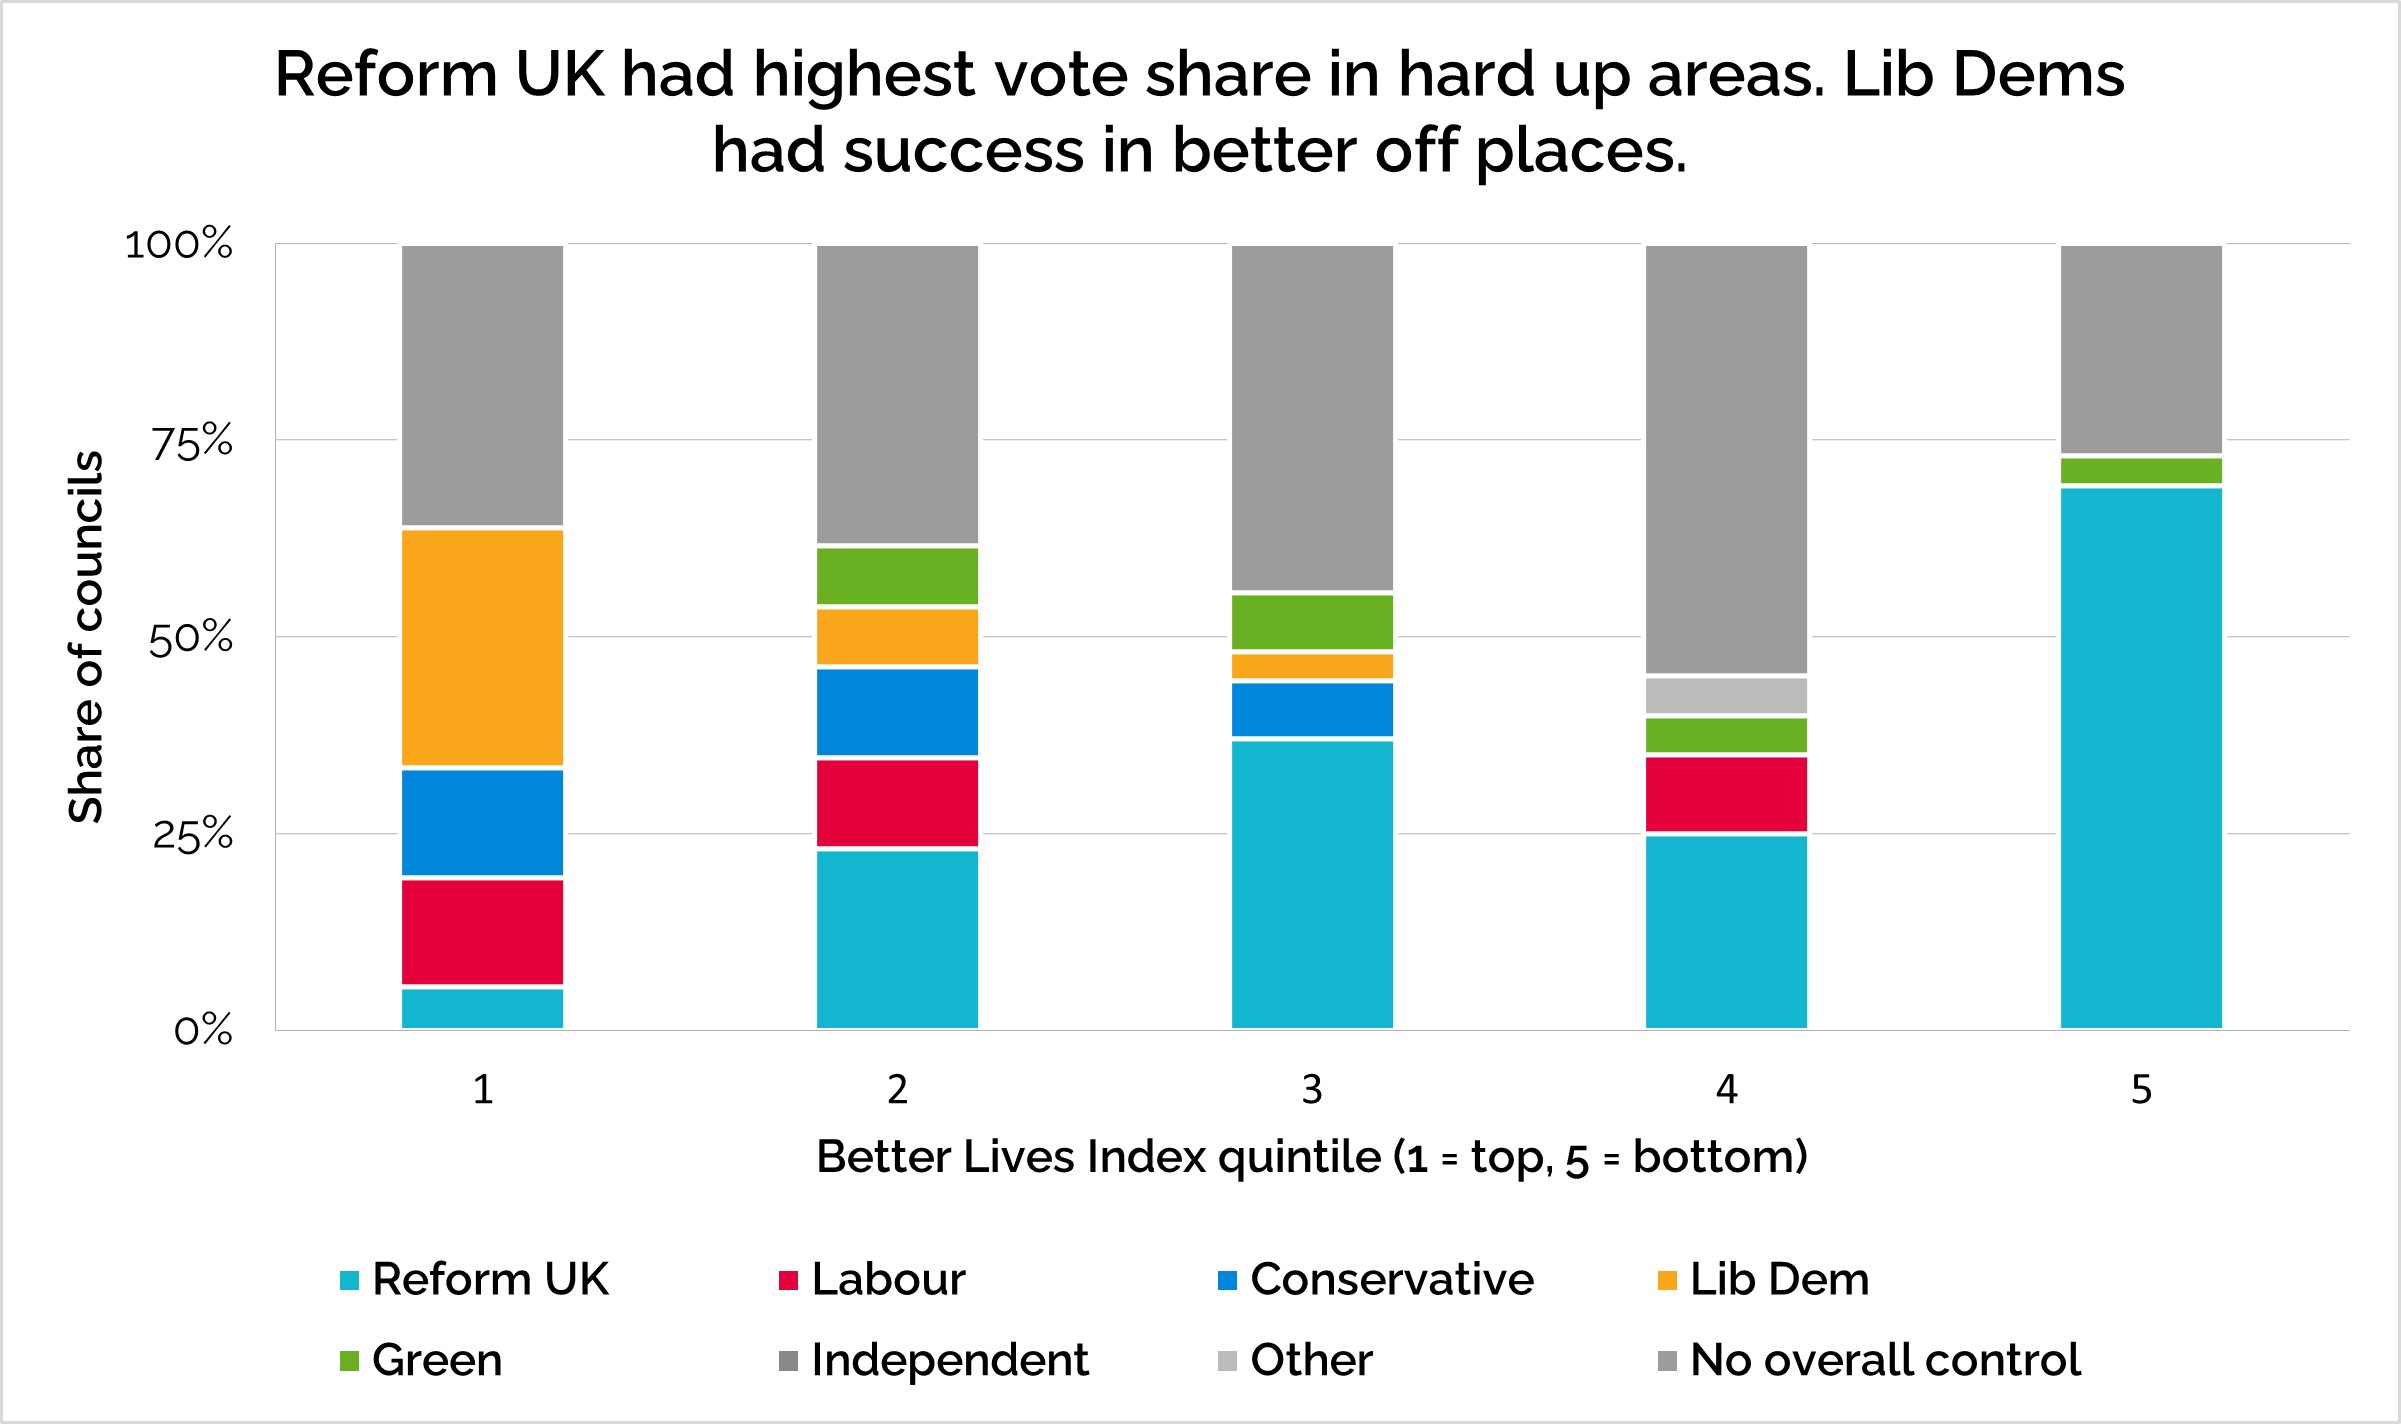
Using the ILC UK Better Lives Index, which measures how well local areas support people to live better, longer lives, we show that over two-thirds of councils (69%) in the worst-off areas are now controlled by Reform UK. This compares to one in eighteen councils in the best-off areas.
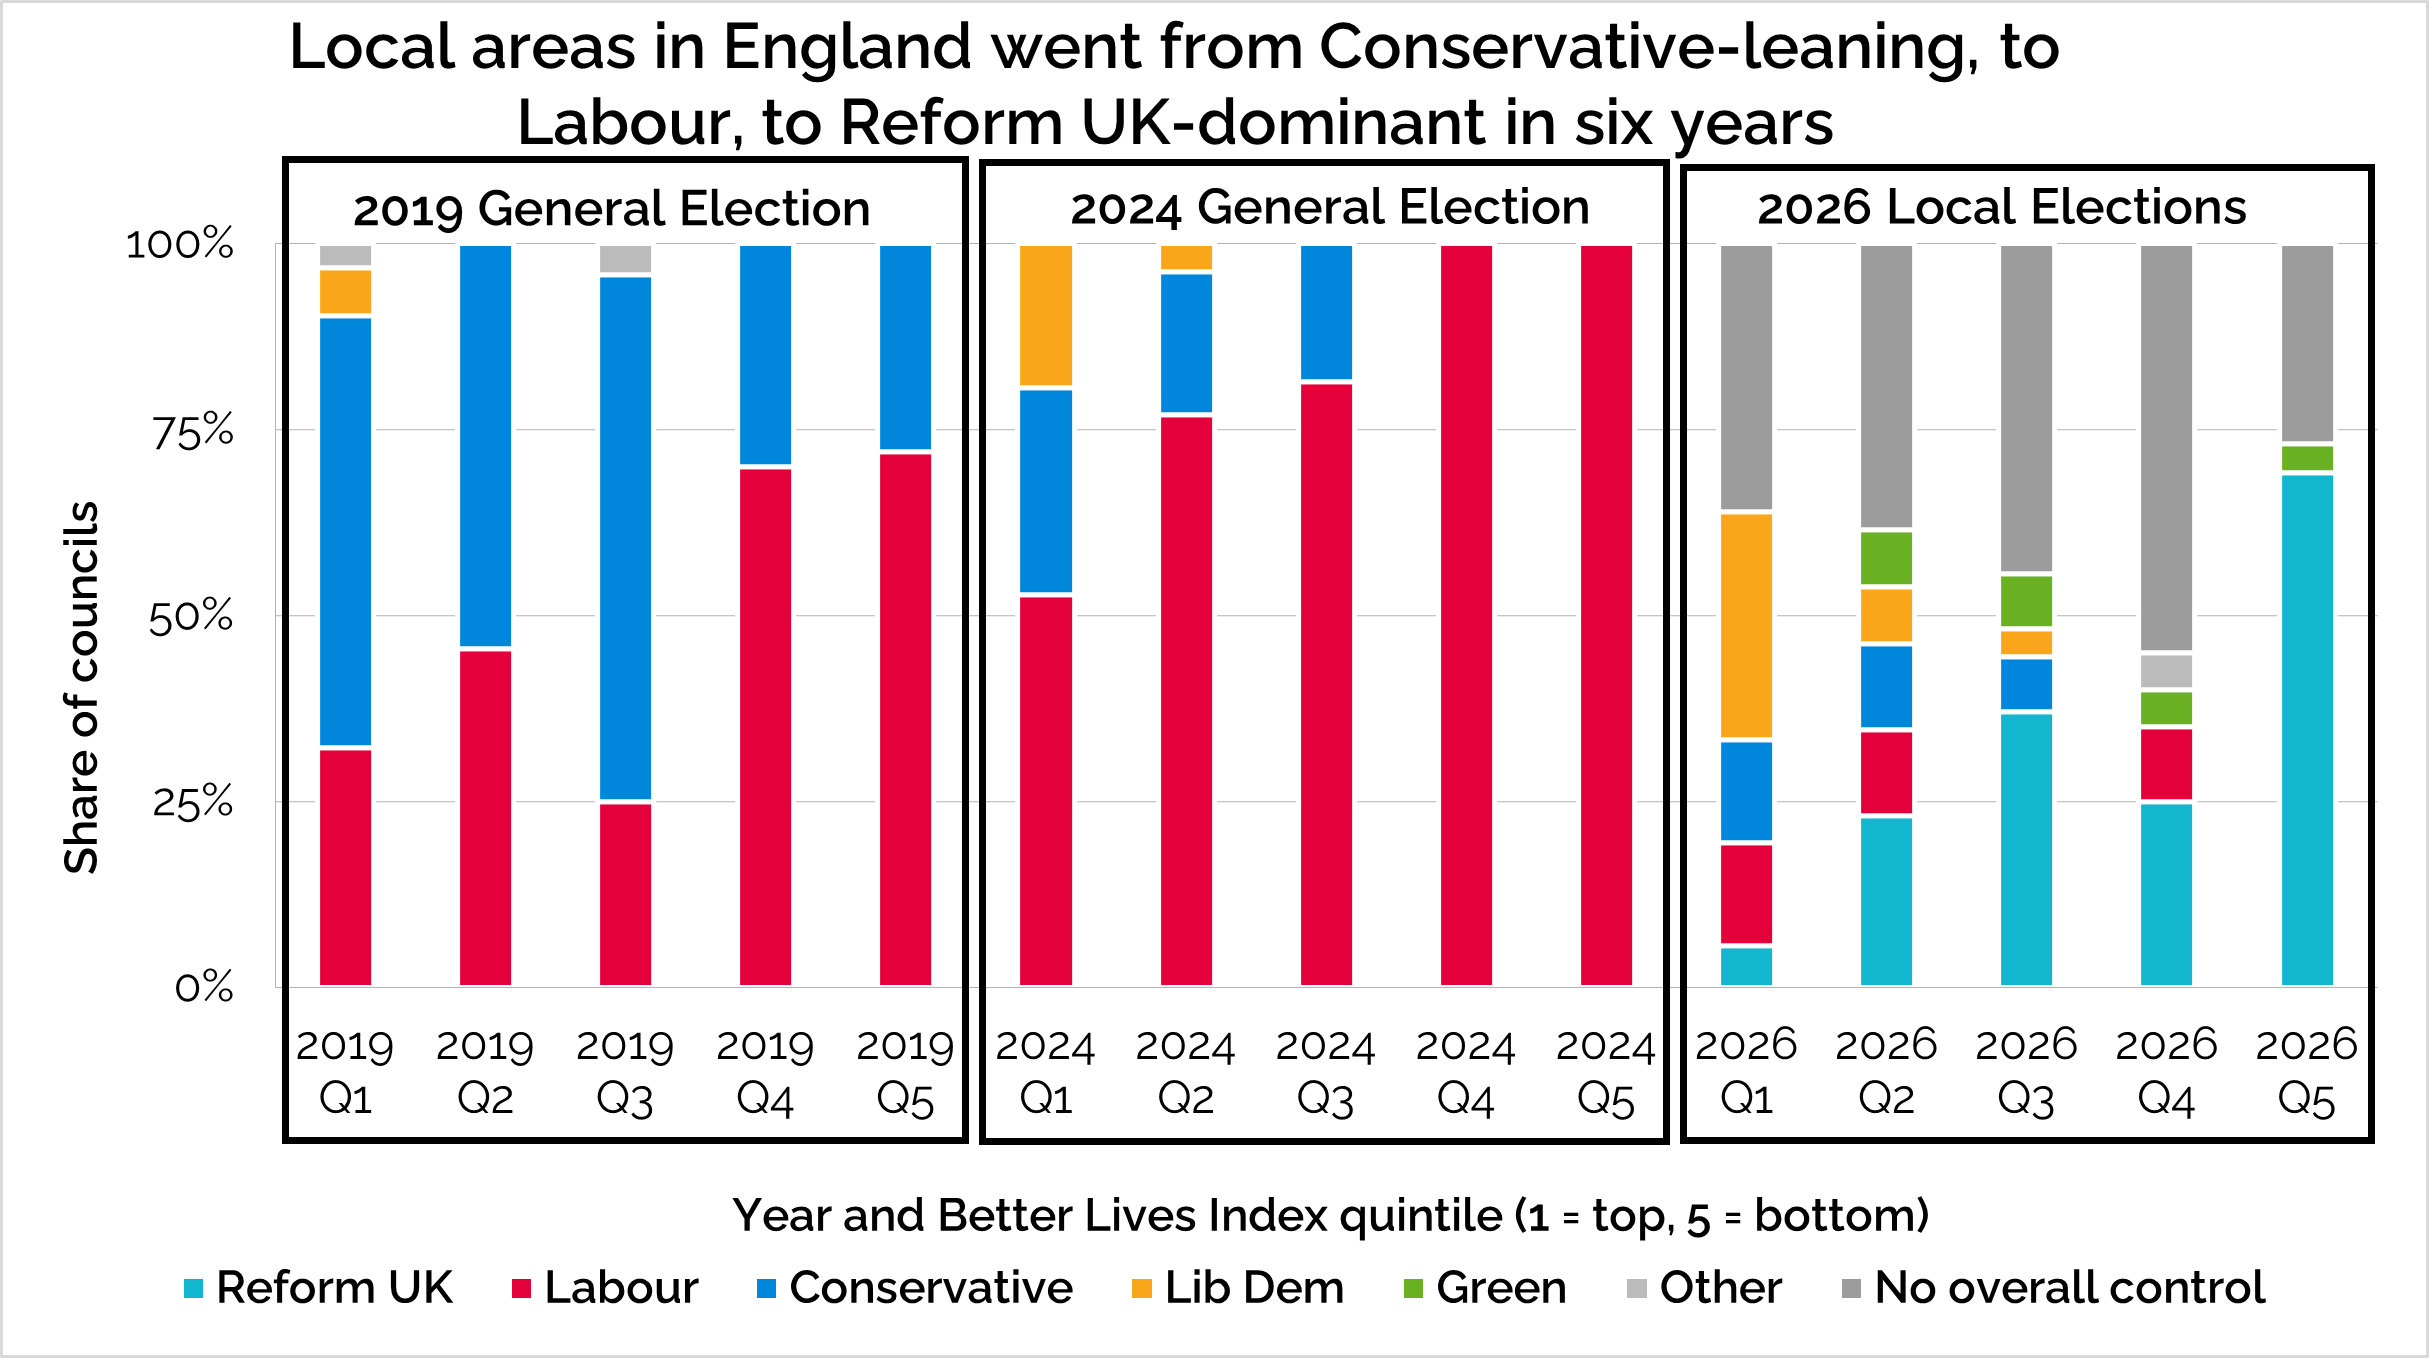
This is particularly concerning for Labour whose General Election victory in 2024 was predicated on winning parliamentary seats in hard up places. The local election results are also a harsh reckoning for the Conservative Party who no longer control any councils in the bottom 40% of areas on our index. The clear failures in delivering “levelling up” are now coming back to bite.
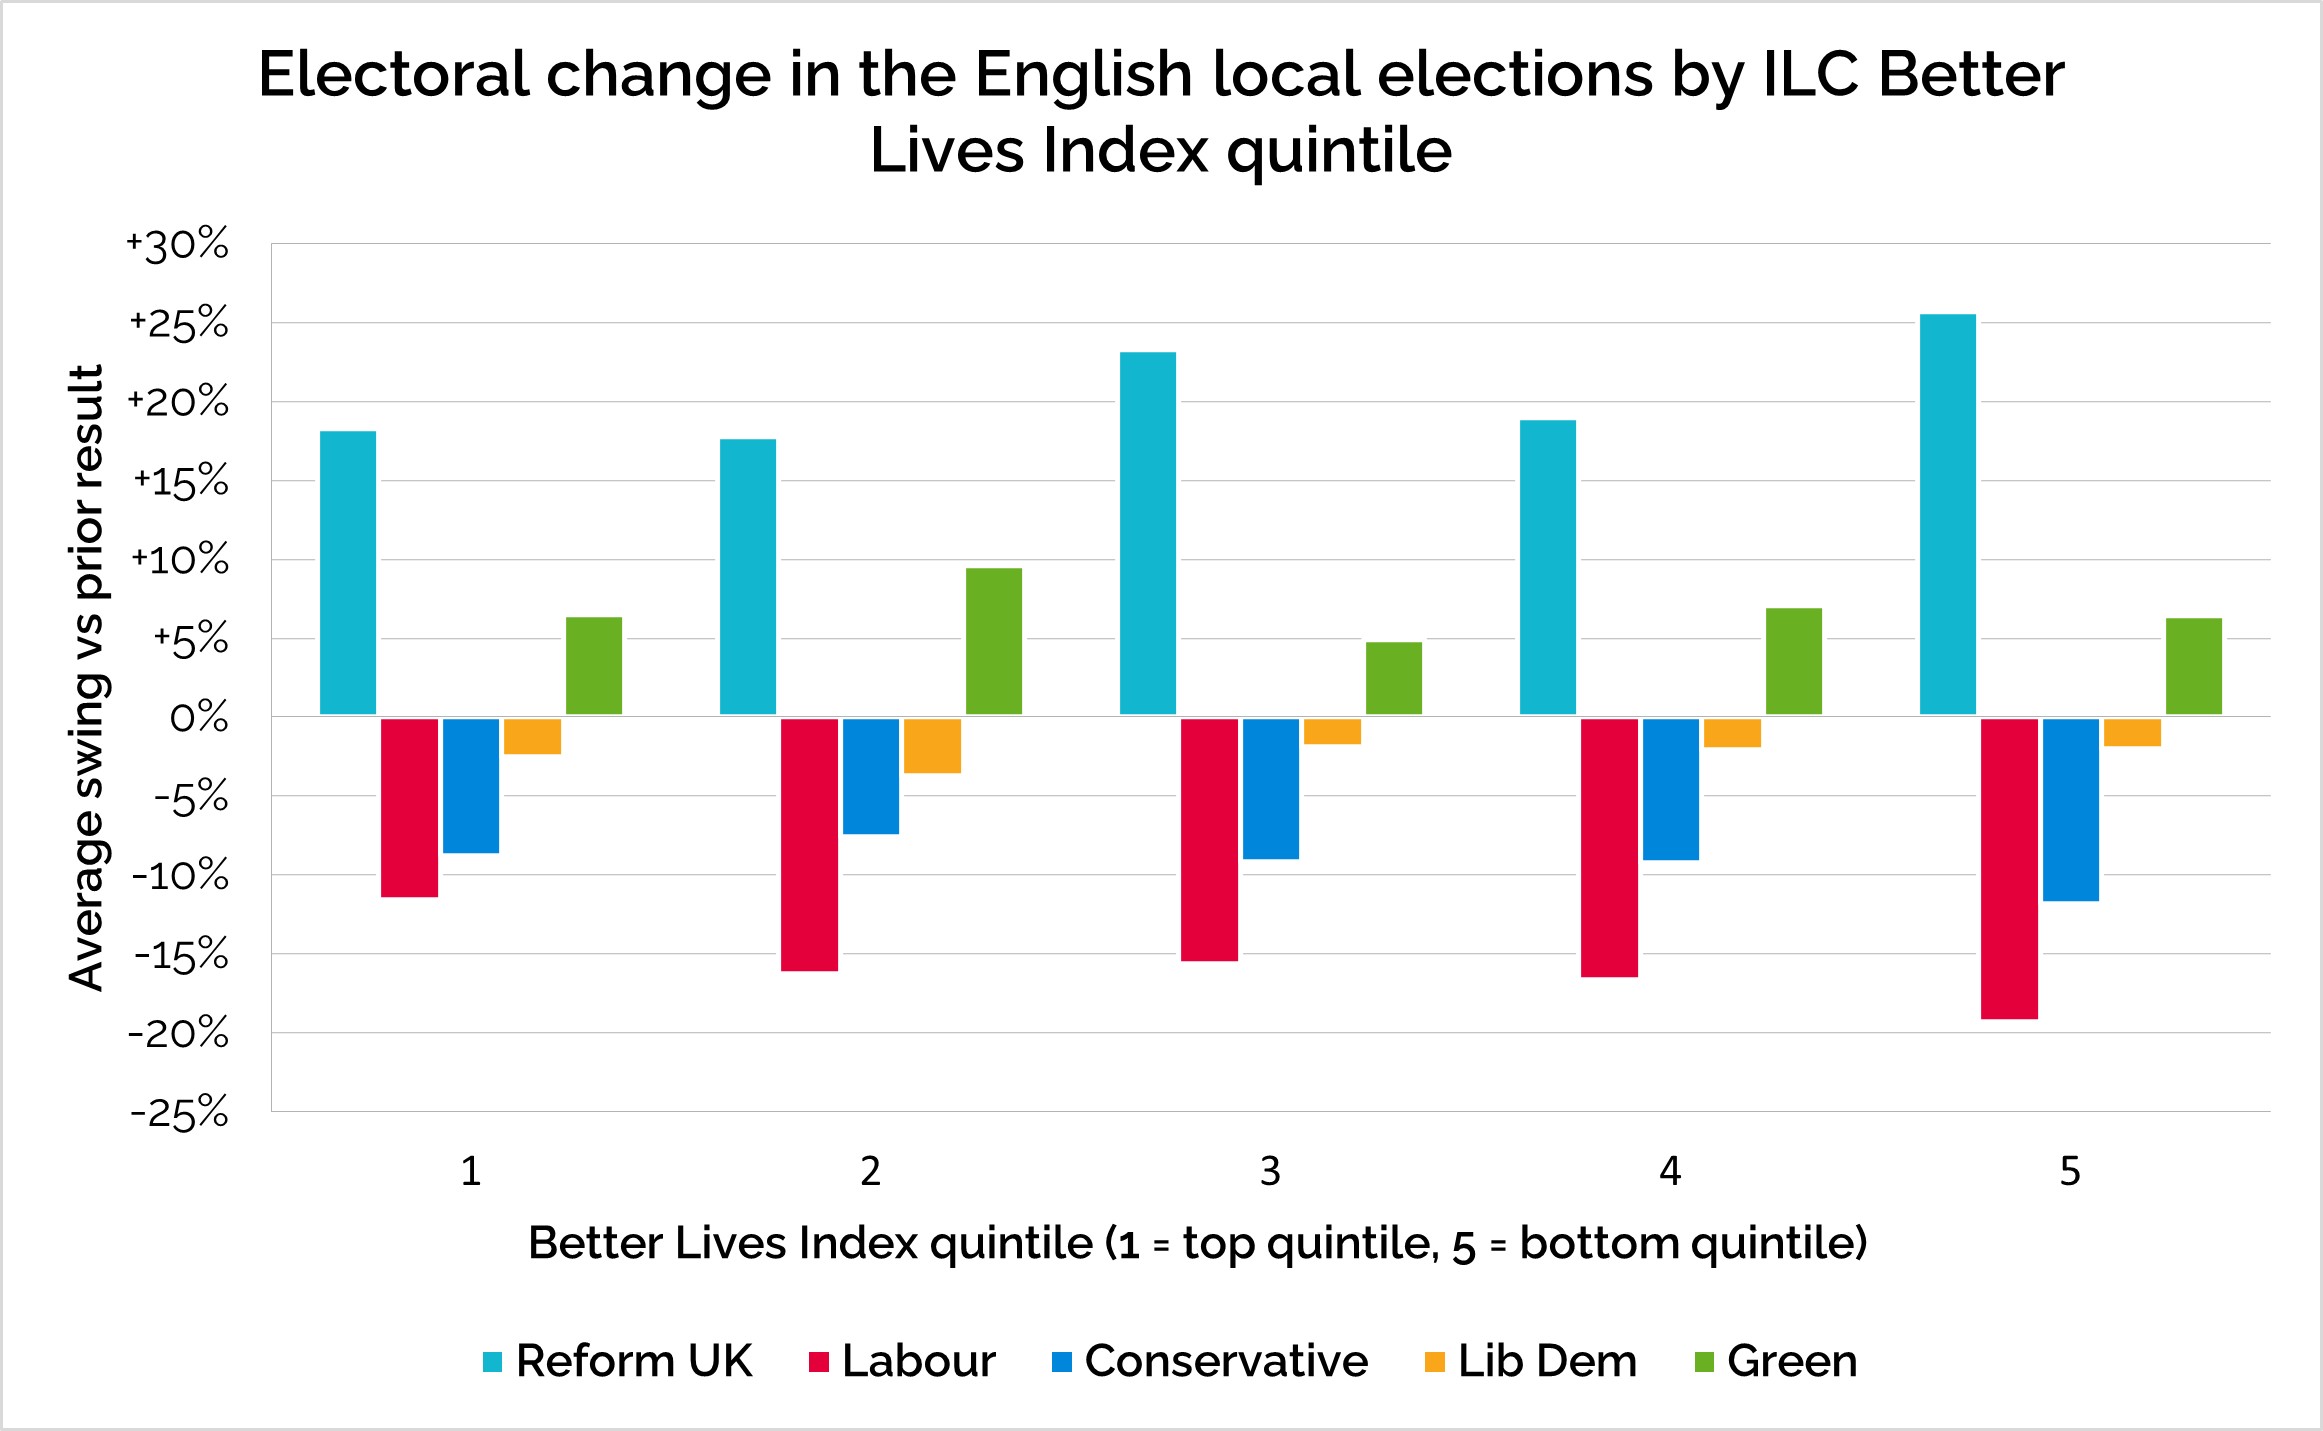
Looking at changes in the vote shows how Reform UK did well across all councils but particularly in the hardest up – seeing a 25% swing in those at the bottom end of the Index whereas Labour saw a fall in vote share of nearly 20% and the Conservatives more than 10%. The Greens were the other party to benefit at the local elections though do not have the same momentum as Reform UK particularly in worst off places.
Tanya Singh, ILC’s Senior Research Fellow who conducted the analysis said:
“People are highly engaged in politics and increasingly impatient for real and tangible improvements to their lives. In many of the country’s worst-off areas, communities have endured years of false starts and broken promises. People want the basics of a good life – healthier, longer lives free from poverty, decent jobs for younger and older workers alike, affordable housing and clean, safe local environments. The message from voters could not be clearer – deliver the ingredients for better lives, and quickly, or be punished at the ballot box.”
Ends
Notes on the ILC Better Lives Index
The ILC’s UK Better Lives Index brings together robust, UK-wide data to show the best and worst places to be born, grow up and grow old. It reveals how place continues to shape health, opportunity and ageing – and where change is most urgently needed.
The UK Better Lives Index has been designed to capture these inequalities and to shed light on what needs to change by ranking 359 local authorities on nine key indicators across the life course:
Better lives, from birth 1. Life expectancy at birth | Better lives, as we grow up 4. Economic activity rate (16+) | Better lives, as we grow old 7. Economic activity rate (50-64) |
The UK Better Lives Index is made possible by support and educational grants from the Hallmark Foundation, Edwards Lifesciences and Pfizer
Method Notes
This analysis draws on two datasets:
• The ward-level results from the May 2026 English local elections, covering 2,554 wards across 130 district-level councils and 427 divisions across 6 county councils.
• ILC's UK Better Lives Index (BLI), which ranks all 359 English local authorities from 1 (best) to 359 (worst) on a range of health and economic wellbeing indicators.
The UK Better Lives Index ranks councils at a specific tier of local government – lower-tier and unitary authorities. The 2026 elections involved 135 councils, not all of which sit at that same tier. We handled this in three ways.
1) For district councils, London boroughs, unitary authorities, and metropolitan boroughs, the match was straightforward: each maps directly to a single BLI entry.
2) For the six county councils that held elections in 2026 – East Sussex, Essex, Hampshire, Norfolk, Suffolk, and West Sussex – there is no single BLI rank, because counties sit above the tier at which the BLI operates. Each county contains several districts, each with its own BLI rank. For these counties, we averaged the BLI ranks of their constituent districts. This mirrors the method used in ILC's analysis of the 2025 county elections.
3) Surrey is undergoing local government reorganisation and will be replaced by two new unitary authorities in 2027. The 2026 results file reflects this by splitting Surrey's 81 divisions between "East Surrey" and "West Surrey." As neither is yet a real local authority, we treated both as a single entity and matched them to Surrey's existing BLI rank – calculated as the average across Surrey's 11 constituent districts. This means some variation within Surrey (the east is generally less affluent than the west) is not captured, but it keeps the analysis consistent with the rest of the dataset.
How council-level figures were calculated
For each council, we counted seats won by party across all wards and calculated vote share by summing each party's votes across wards and dividing by the total votes cast. To get an accurate total, we reconstructed ward-level turnout from the vote counts and percentage shares provided in the source data – this matters most in places with strong local parties, such as Aspire in Tower Hamlets, where a simple sum of the named parties' votes would undercount the true denominator.
Swing figures are unweighted averages of ward-level changes in vote share, compared against the previous equivalent election – in most cases, 2022.
Ten seats across six councils (Bradford, Bury, Hillingdon, St Helens, Tamworth, and Essex) were undeclared at the time of compilation and are excluded.
The analysis covers 5,036 of the 5,046 seats that were up for election.
A council is recorded as having overall control if the largest party holds more than half of all seats. Otherwise, it is recorded as no overall control (NOC).
The full dataset, is available on request.